For developers
Stop guessing which layer is broken.
Per-trace latency and cost, live fleet topology, and a PR gate for regressions — every claim on a number, a name, or the span.
- Retrieval
- Tool call
- Generation
- Guardrail
Generation dominates p99 — the retrieval layer is not the bottleneck. Drill straight into the slow traces from here.
| Span | Phase | Duration |
|---|---|---|
| span_9c41… | generation | 8 412 ms |
| span_2be7… | generation | 6 980 ms |
| span_44f0… | guardrail | 1 204 ms |
4.1 Performance debugging
Know which layer is actually slow.
Find the layer, not the vibe. Latency is broken out by the work that actually happened, so the answer is a fact rather than a hunch.
Block A — phase-sliced latency
p50, p95 and p99 — by retrieval, tool call, generation, and guardrail.
So the answer is “generation is the slow part, not the database” — a fact, not a hunch. Then drill from the slow phase into the offending traces and down to the individual spans, with the errors and the slow outliers already badged.
- Thresholds are computed live off your own data —
- not a number someone picked for a different workload.
- Drill-down is one click deep —
- phase → offending traces → individual spans, with outliers badged.
What you get: a named layer to fix and the span IDs to open, instead of a waterfall to squint at.
- Retrieval
- Tool call
- Generation
- Guardrail
Generation dominates p99 — the retrieval layer is not the bottleneck. Drill straight into the slow traces from here.
| Span | Phase | Duration |
|---|---|---|
| span_9c41… | generation | 8 412 ms |
| span_2be7… | generation | 6 980 ms |
| span_44f0… | guardrail | 1 204 ms |
Block B — per-trace cost and latency
Debug one expensive request, not a monthly average.
Every trace carries its own cost and its own phase breakdown. When someone reports that one request was slow or one customer’s workflow got expensive, you open that trace — not a dashboard of aggregates.
What you get: dollars and milliseconds per phase for a single named request, ready to paste into the incident thread.
- Retrieval312 ms$0.0004
- Tool call241 ms$0.0000
- Generation4 108 ms$0.0391
- Guardrail196 ms$0.0021
Every trace carries its own dollars and its own phase breakdown, so you debug the expensive request instead of the monthly bill.
4.2 Cost tools
Not “you spent $40k.” Here is the line to change.
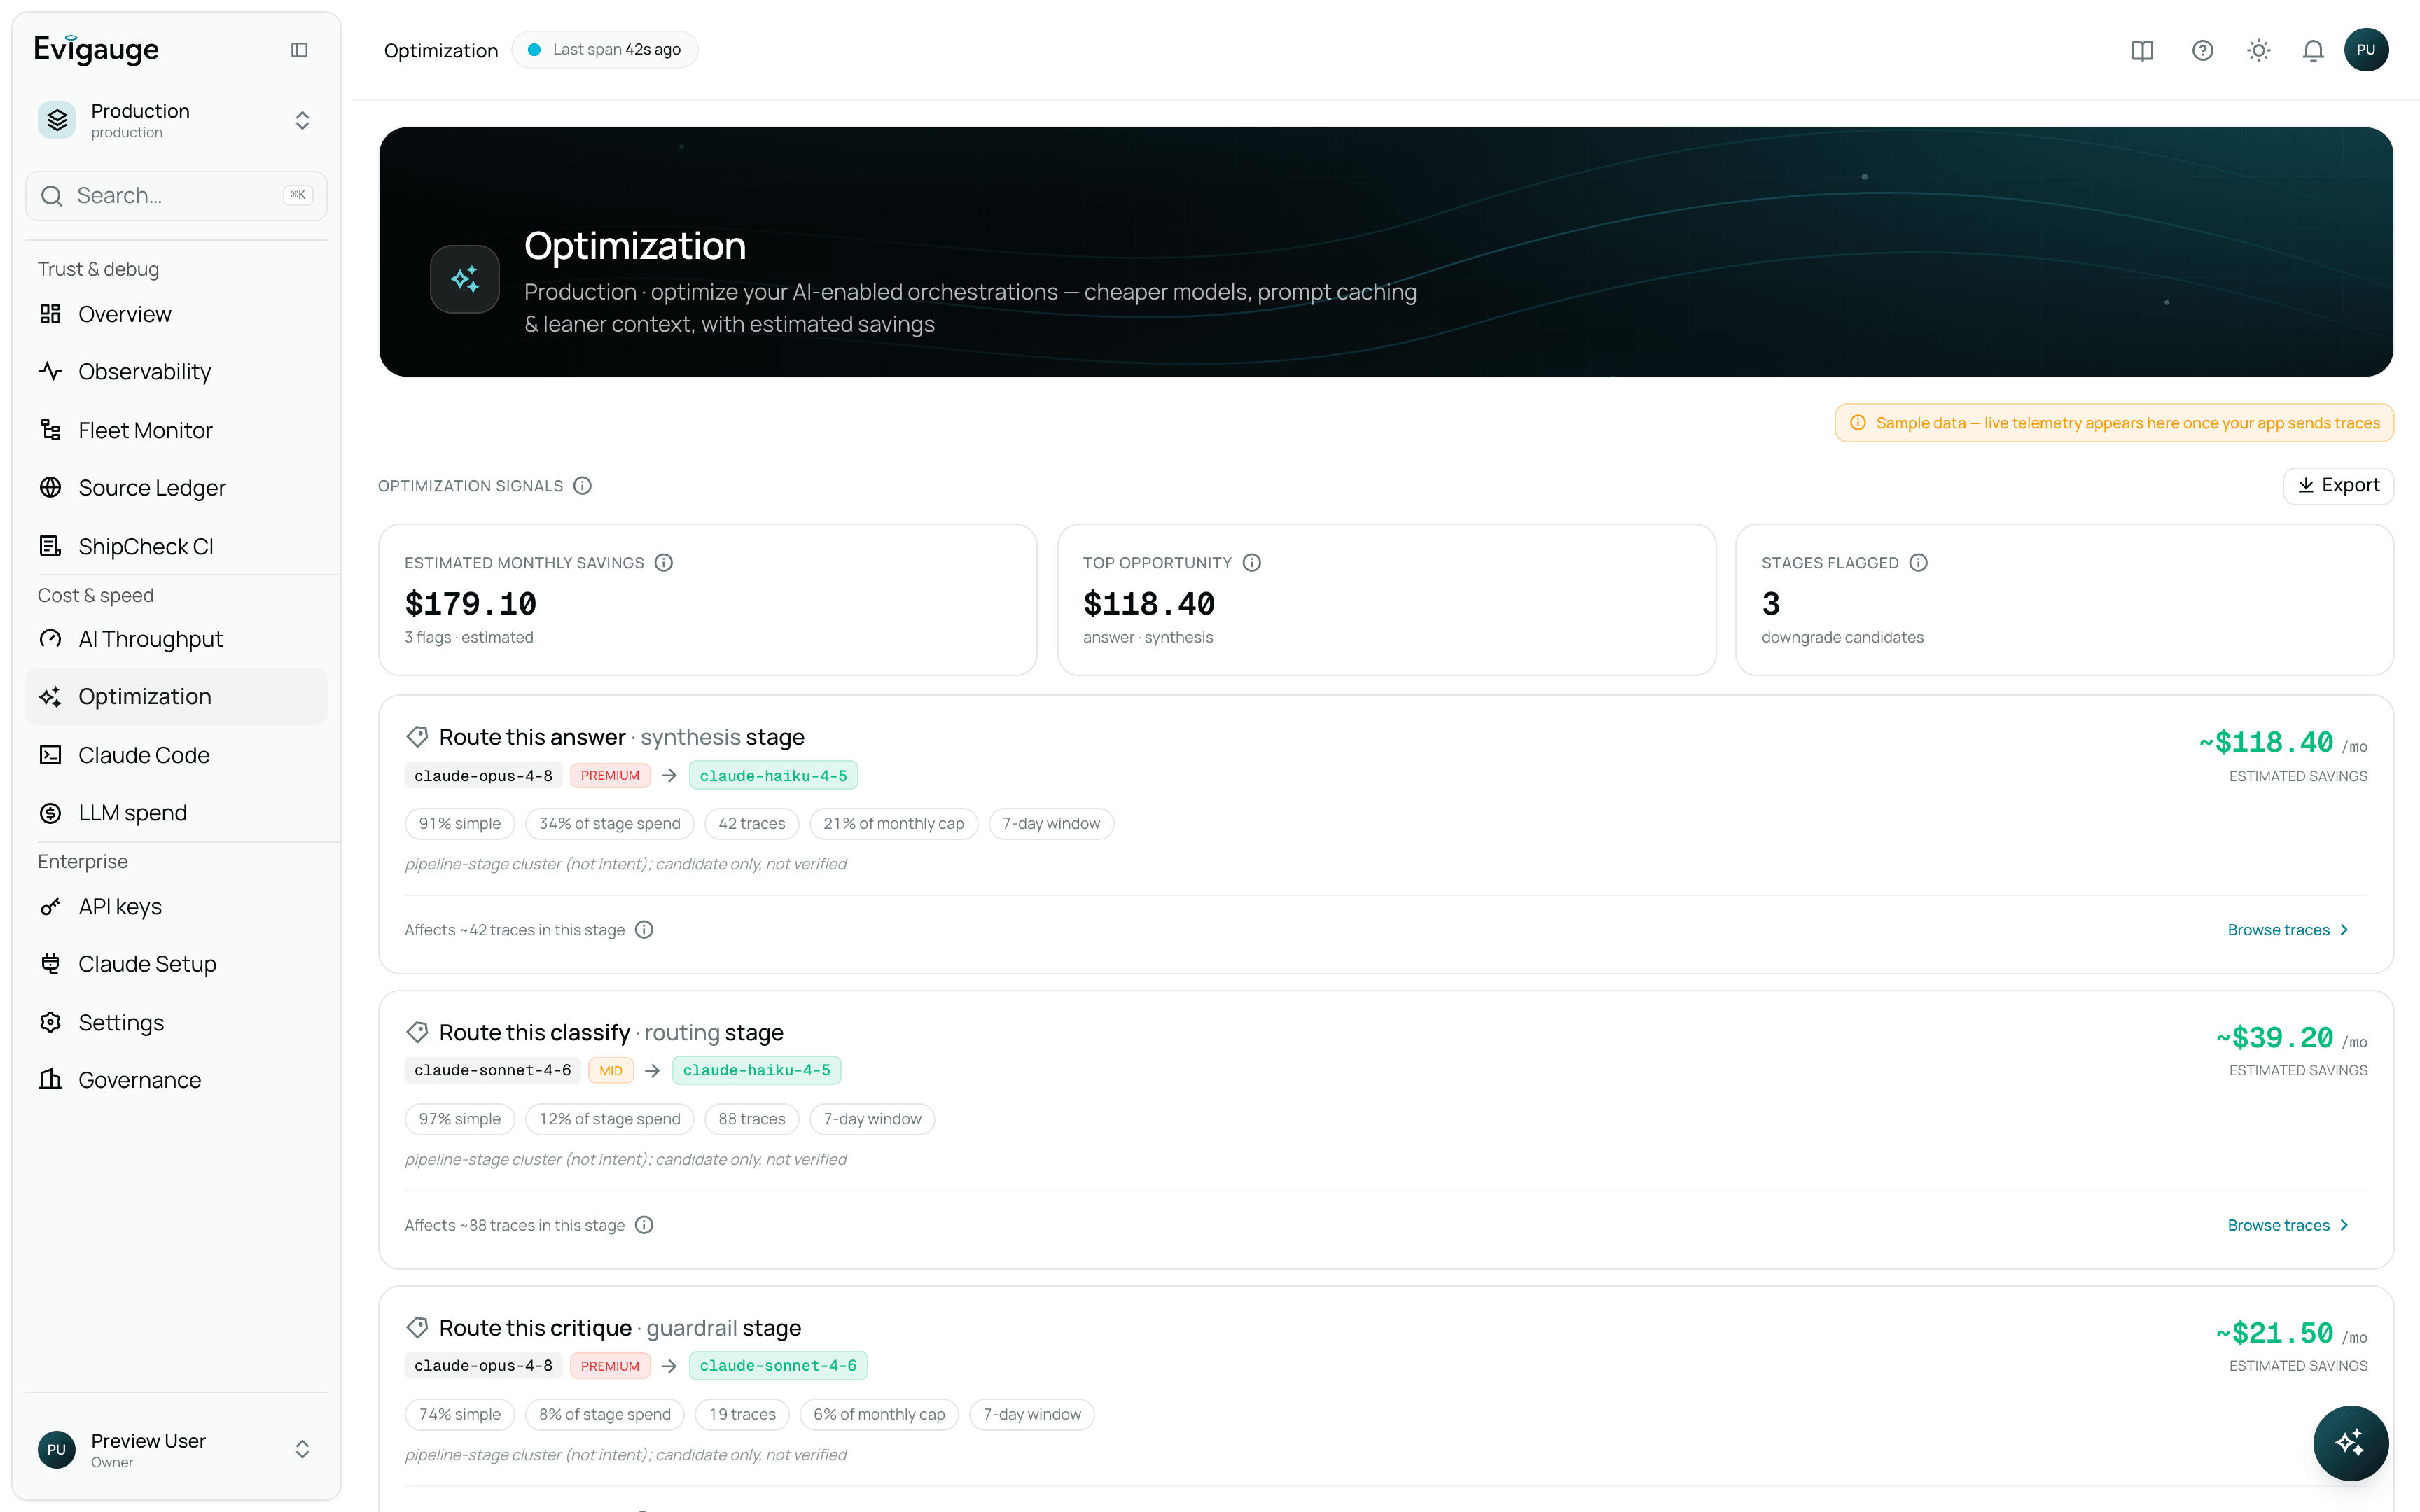
Two engines that produce actionable findings rather than charts — and neither of them ever changes anything for you.
Block A — correlation engine
It names the trace, the cheaper model, and the exact dollars.
The correlation engine flags the specific trace where a premium model did simple work, names the cheaper model that would have handled it, shows the exact dollars, and links straight to the offending span.
It also surfaces the daily pattern — when a whole class of work is over-provisioned, not just one unlucky trace.
What you get: a finding you can act on in one sitting — with the saving quantified before you spend the afternoon on it.
Block B — savings advisor
Where the cache breakpoint goes, for your provider.
The advisor finds your uncached prompt prefix and your re-sent context, measures the stable-prefix token count, and tells you exactly where the cache breakpoint belongs.
Provider-aware, because prefix caching works differently on each provider and generic advice is wrong advice.
What you get: a specific placement in a specific prompt, measured against your own call pattern.
Place the cache breakpoint after the system block and the tool schema — the measured stable prefix — and before the per-call context. Placement is provider-specific, so the advice is written for the provider this workspace actually calls.
These are recommendation engines. They never silently change your models or your prompts. Evigauge names the finding, prices it, and links to the evidence. The developer keeps the wheel.
4.3 Context compression — pxcore
Up to 65.3% less context, the same answer.
Our pxcore library compresses dense context before it ever reaches the model — so you send a fraction of the tokens and pay a fraction of the bill, with the quality of the output preserved.
- Up to 65.3% context compression —
- dense context squeezed down without dropping what actually matters to the answer.
- ~50% cost savings —
- you pay for a fraction of the tokens on the very same workload.
- Precision, kept —
- output quality is maintained and protected — size is cut, accuracy is not traded away.
- Recalibration layer —
- every provider — and every future model — is adapted automatically, so the gains hold as models change.
What you get: roughly half the token bill on context-heavy calls, with the answer unchanged.
65.3%
context compressed
50%
cost saved
Dense context squeezed with precision and output quality preserved — nothing material dropped.
4.4 Multi-agent fleets
See the whole fleet, not one agent at a time.
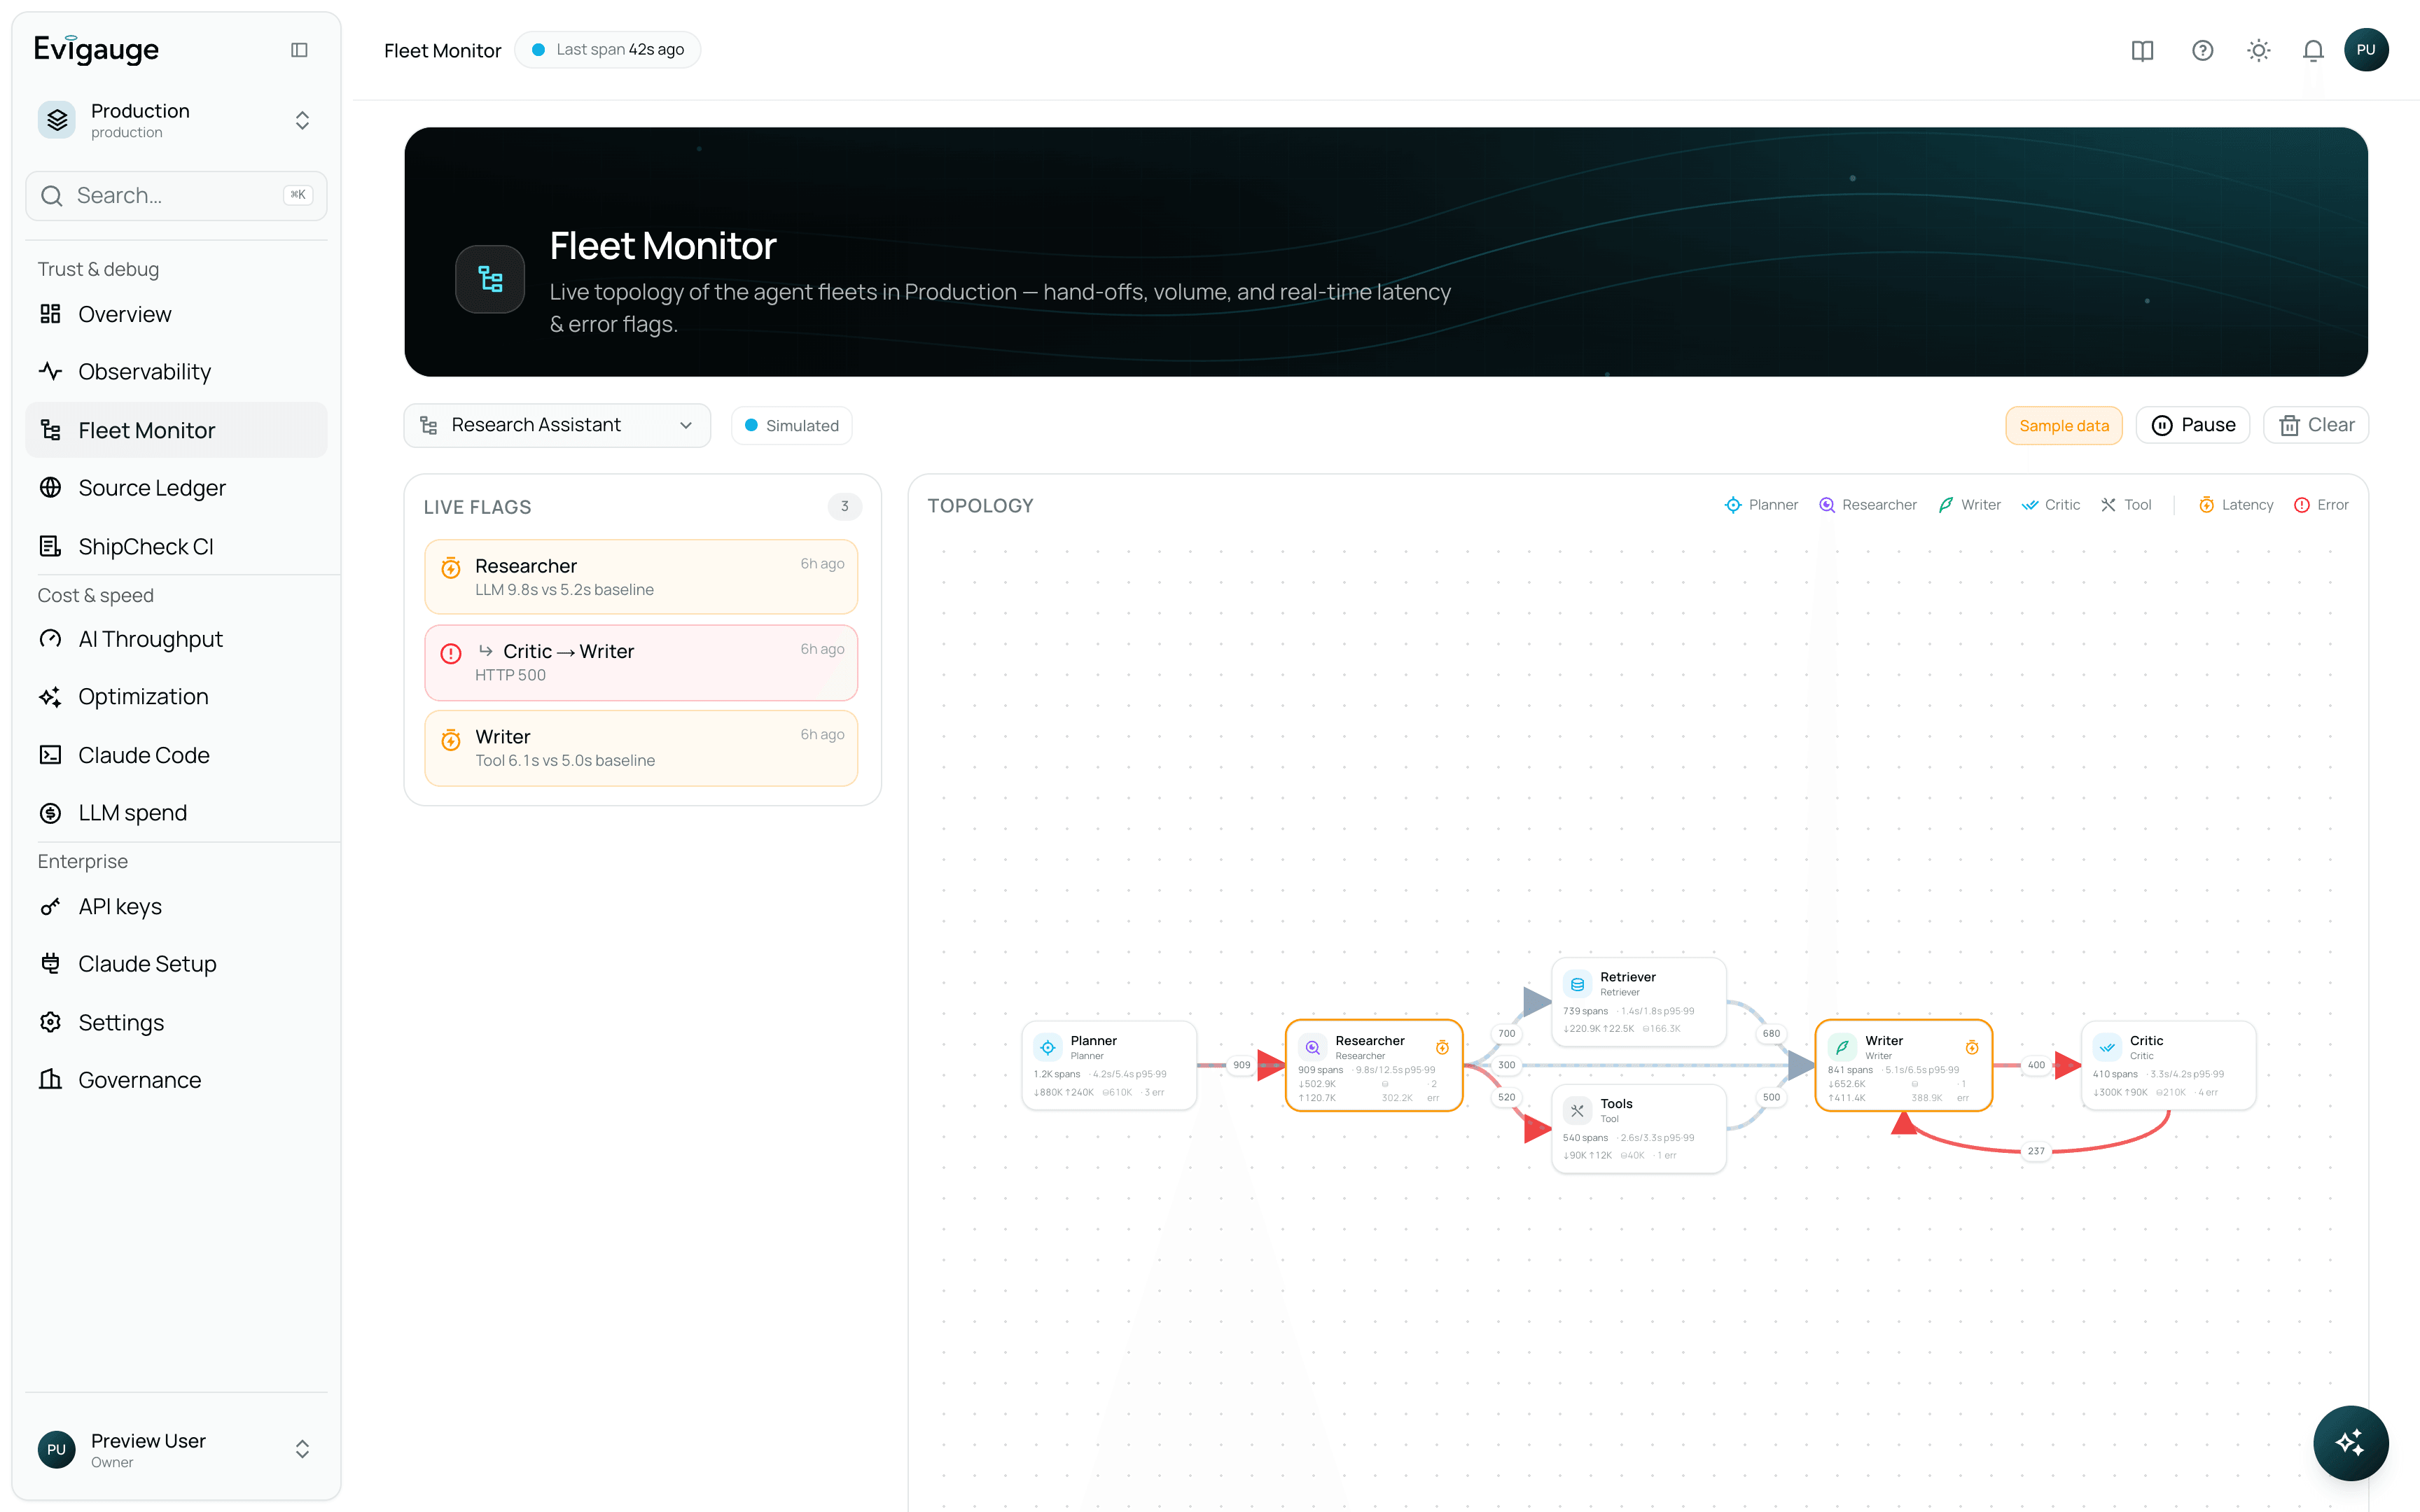
- Live topology —
- which agents call which, and where bottlenecks form.
- Per-agent token and cache usage —
- see exactly which agent is burning the budget or missing cache hits.
- Learned latency baselines —
- thresholds are learned per operation, not as one flat global number — so an alert means something instead of firing on every slow op. Flags also resolve on their own when an agent recovers.
- Zero added latency —
- the fleet monitor reads off-band on its own consumer path. It adds nothing to your request path.
What you get: a fleet view where the alerts are worth reading, and a bottleneck you can point at.
4.5 Catch it before merge
Ship Check — a PR gate for prompts.
- Runs at PR time —
- flags a broken cache, a bloated prompt, or rising failed and empty responses — and it can fail the build.
- Maps your agent and tool surface —
- and flags over-broad permissions before they ship, rather than after an incident.
- Deterministic by design —
- the same diff always produces the same verdict, and every finding carries the literal evidence that produced it.
What you get: the regression gets caught in review, by a check your team can trust not to flap.
Ship Check failed — 2 of 4 checks. This build is blocked.
Prompt cache integrity
Stable prefix broken — a timestamp moved above the cache breakpoint.
line 41: `You are… (generated {{now}})`
Agent permission surface
tool `filesystem.write` widened from a scoped path to the workspace root.
agents/support.yaml +12
Prompt size budget
Within budget (no growth on this diff).
Failed / empty response rate
No regression detected on the replay set.
4.6 If your team uses coding agents
Turn “is this actually helping?” into a number.
Evigauge tracks cost, lines of code accepted versus rejected, sessions, and commits per engineer for coding-agent work — the same reconstruction lens applied to AI-assisted development.
It answers the question an engineering leader actually gets asked, with data rather than anecdote.
What you get:accepted-versus-rejected lines per engineer, per week, with the cost attached.
Accepted LOC
share of suggested
Sessions
per engineer
Commits
agent-assisted
- Engineer A74%18s · 11c
- Engineer B52%24s · 9c
- Engineer C88%9s · 14c
Cost sits alongside every row, so “is AI coding helping?” resolves to a number you can take into a planning meeting.
4.7 You're not locked in
Your models. Your keys. Your infrastructure.
Toggle engines per workspace
Turn any reconstruction engine on or off for a workspace. No redeployment, no rebuild, no ticket.
Bring your own model provider
Any provider, cloud or on-premise. Your keys are encrypted, never logged, and never echoed back to you.
Self-host or air-gap the whole thing
Run Evigauge in your VPC, on your own metal, or fully disconnected from the internet.
4.8 Instrument your app
First trace in under five minutes.
Install the SDK, add one workspace key, and the engines start reading your traffic. Already on OpenTelemetry? Point the exporter at Evigauge instead.
# 1 — install the Evigauge tracing SDK
#     pip install <evigauge-tracing-sdk>

from evigauge import trace

trace.init(
    workspace_key="evg_ws_...",   # one key per workspace
    service="support-assistant",
)

# 2 — that's it. LLM calls, tool calls, retrieval and
#     decisions in this process are now reconstructed.
The published package name is being finalised ahead of launch, so the install line above shows <evigauge-tracing-sdk> as a placeholder. The current install command is included in the demo.
Screens above are captures of the live product, shown on sample data.
Bring one slow trace. We will name the layer.
45 minutes, your own workload. We instrument it, walk the phase breakdown, and show you the cost findings against your real traffic.
Prefer email? info@evigauge.com