Product · how it works
See how every answer was actually made.
Install the SDK, add your keys, and the dashboard reconstructs itself — provenance, reasoning, and cost, from your app's own execution. No prompt rewrites.
From black box to full provenance
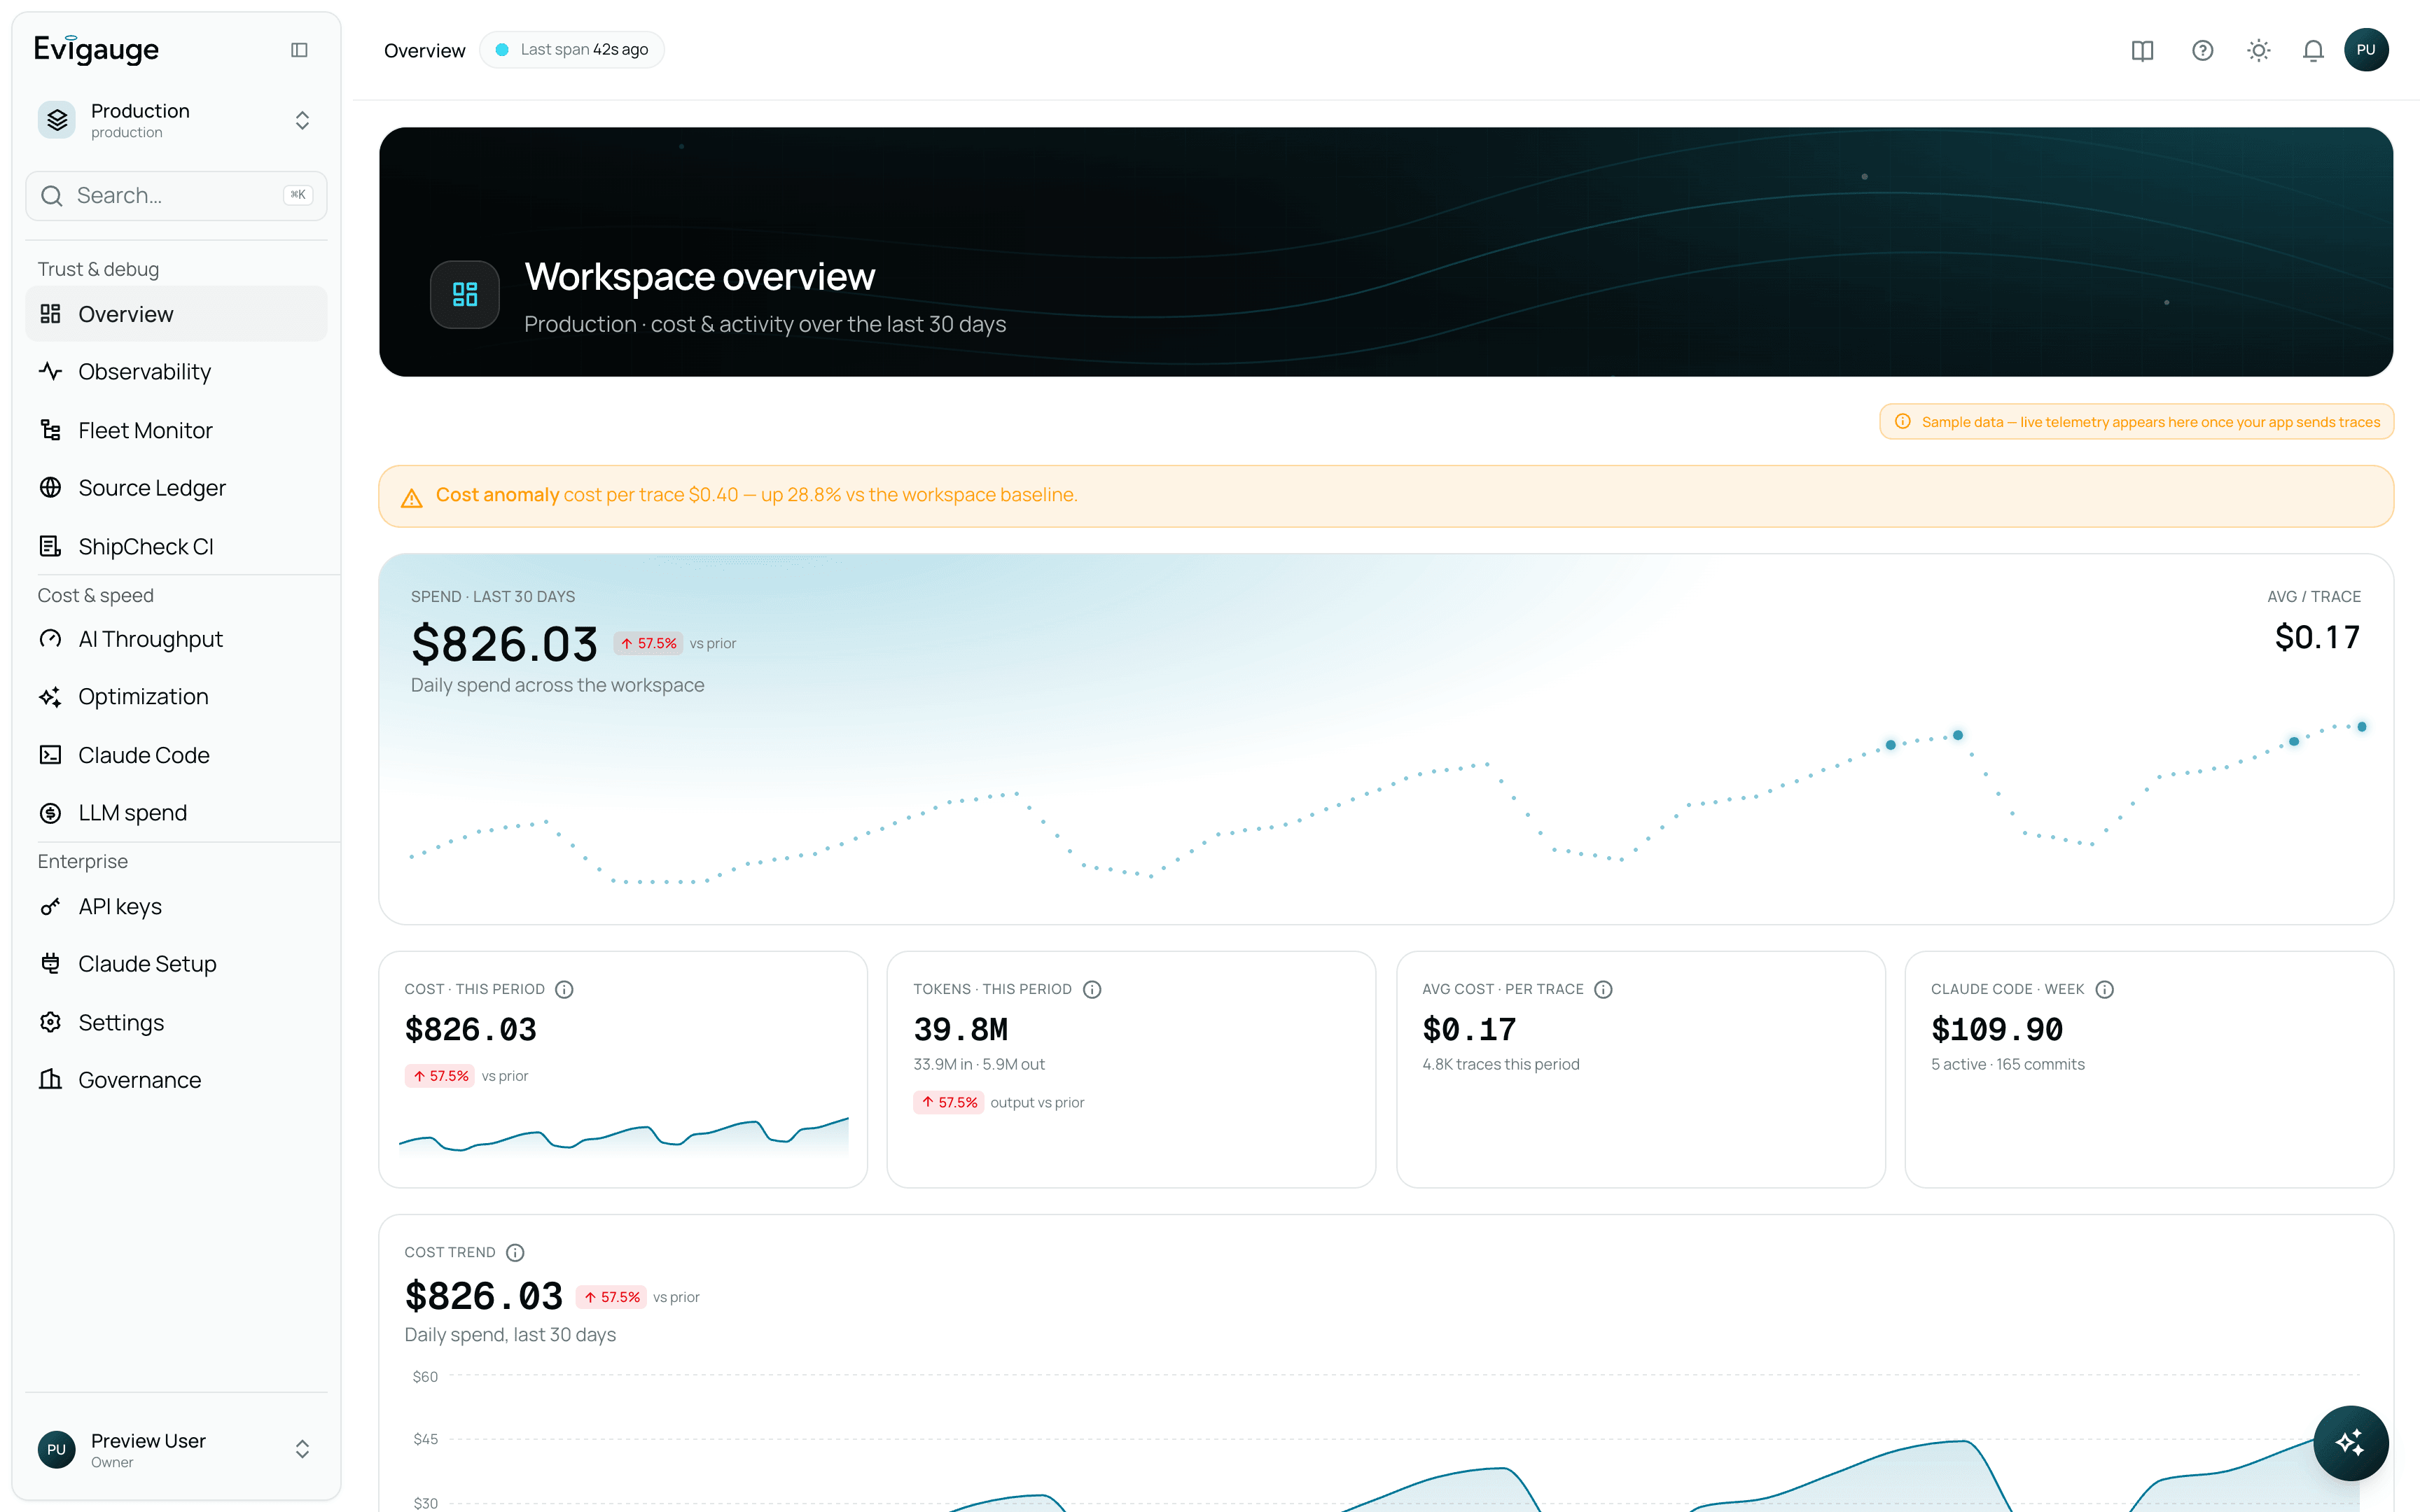
Evigauge reconstructs how every AI answer was made — the query decomposition, the reasoning path, the sources cited and dropped, whether the claims were grounded, and where the money went. It reads your app's own execution, so there is nothing to rewrite.
- One SDK, one API key per workspace.
- Auto-instruments LLM calls, tool calls, retrieval, and decisions.
- Standards-native — stock OpenTelemetry exporters work out of the box.
Connect in minutes
Drop in the tracing SDK and add your keys. Evigauge instruments the calls already happening in your app — no prompt rewrites, no re-instrumentation. The panels fill themselves as traffic flows.
Reconstruct every answer
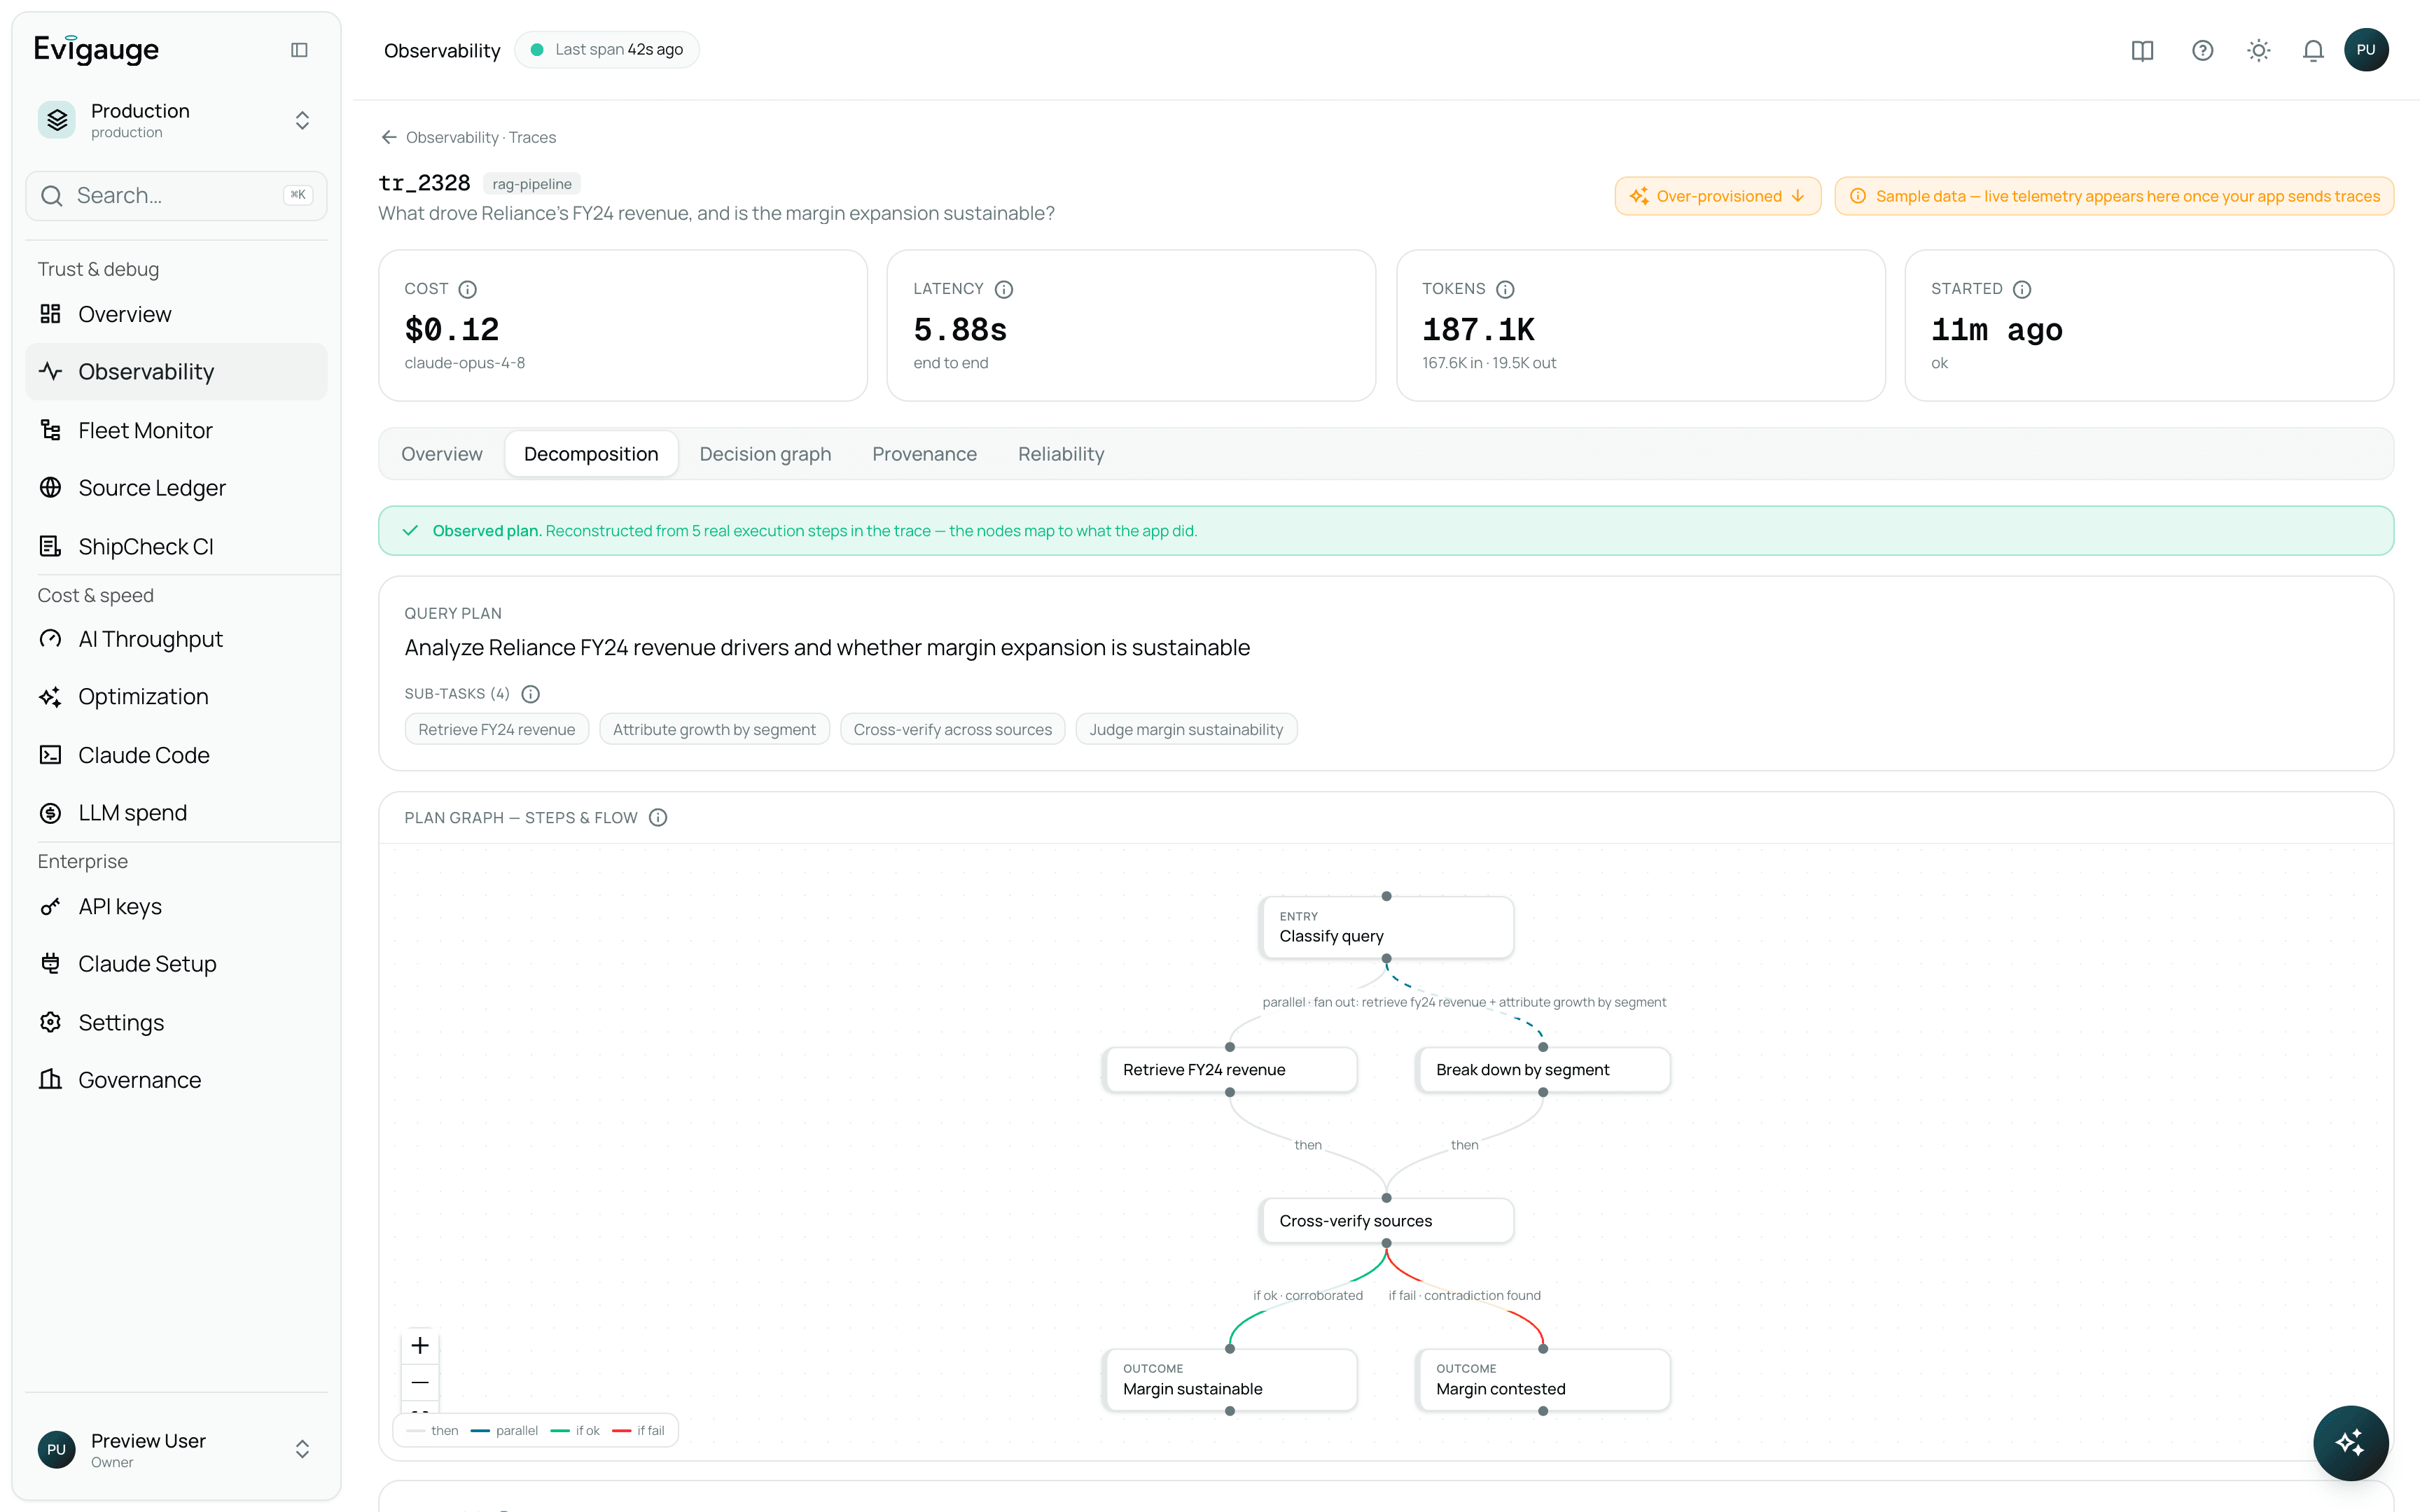
For any answer, Evigauge rebuilds the whole picture — not a span waterfall you have to guess from, but the actual decomposition, sourcing, and reasoning behind the result.
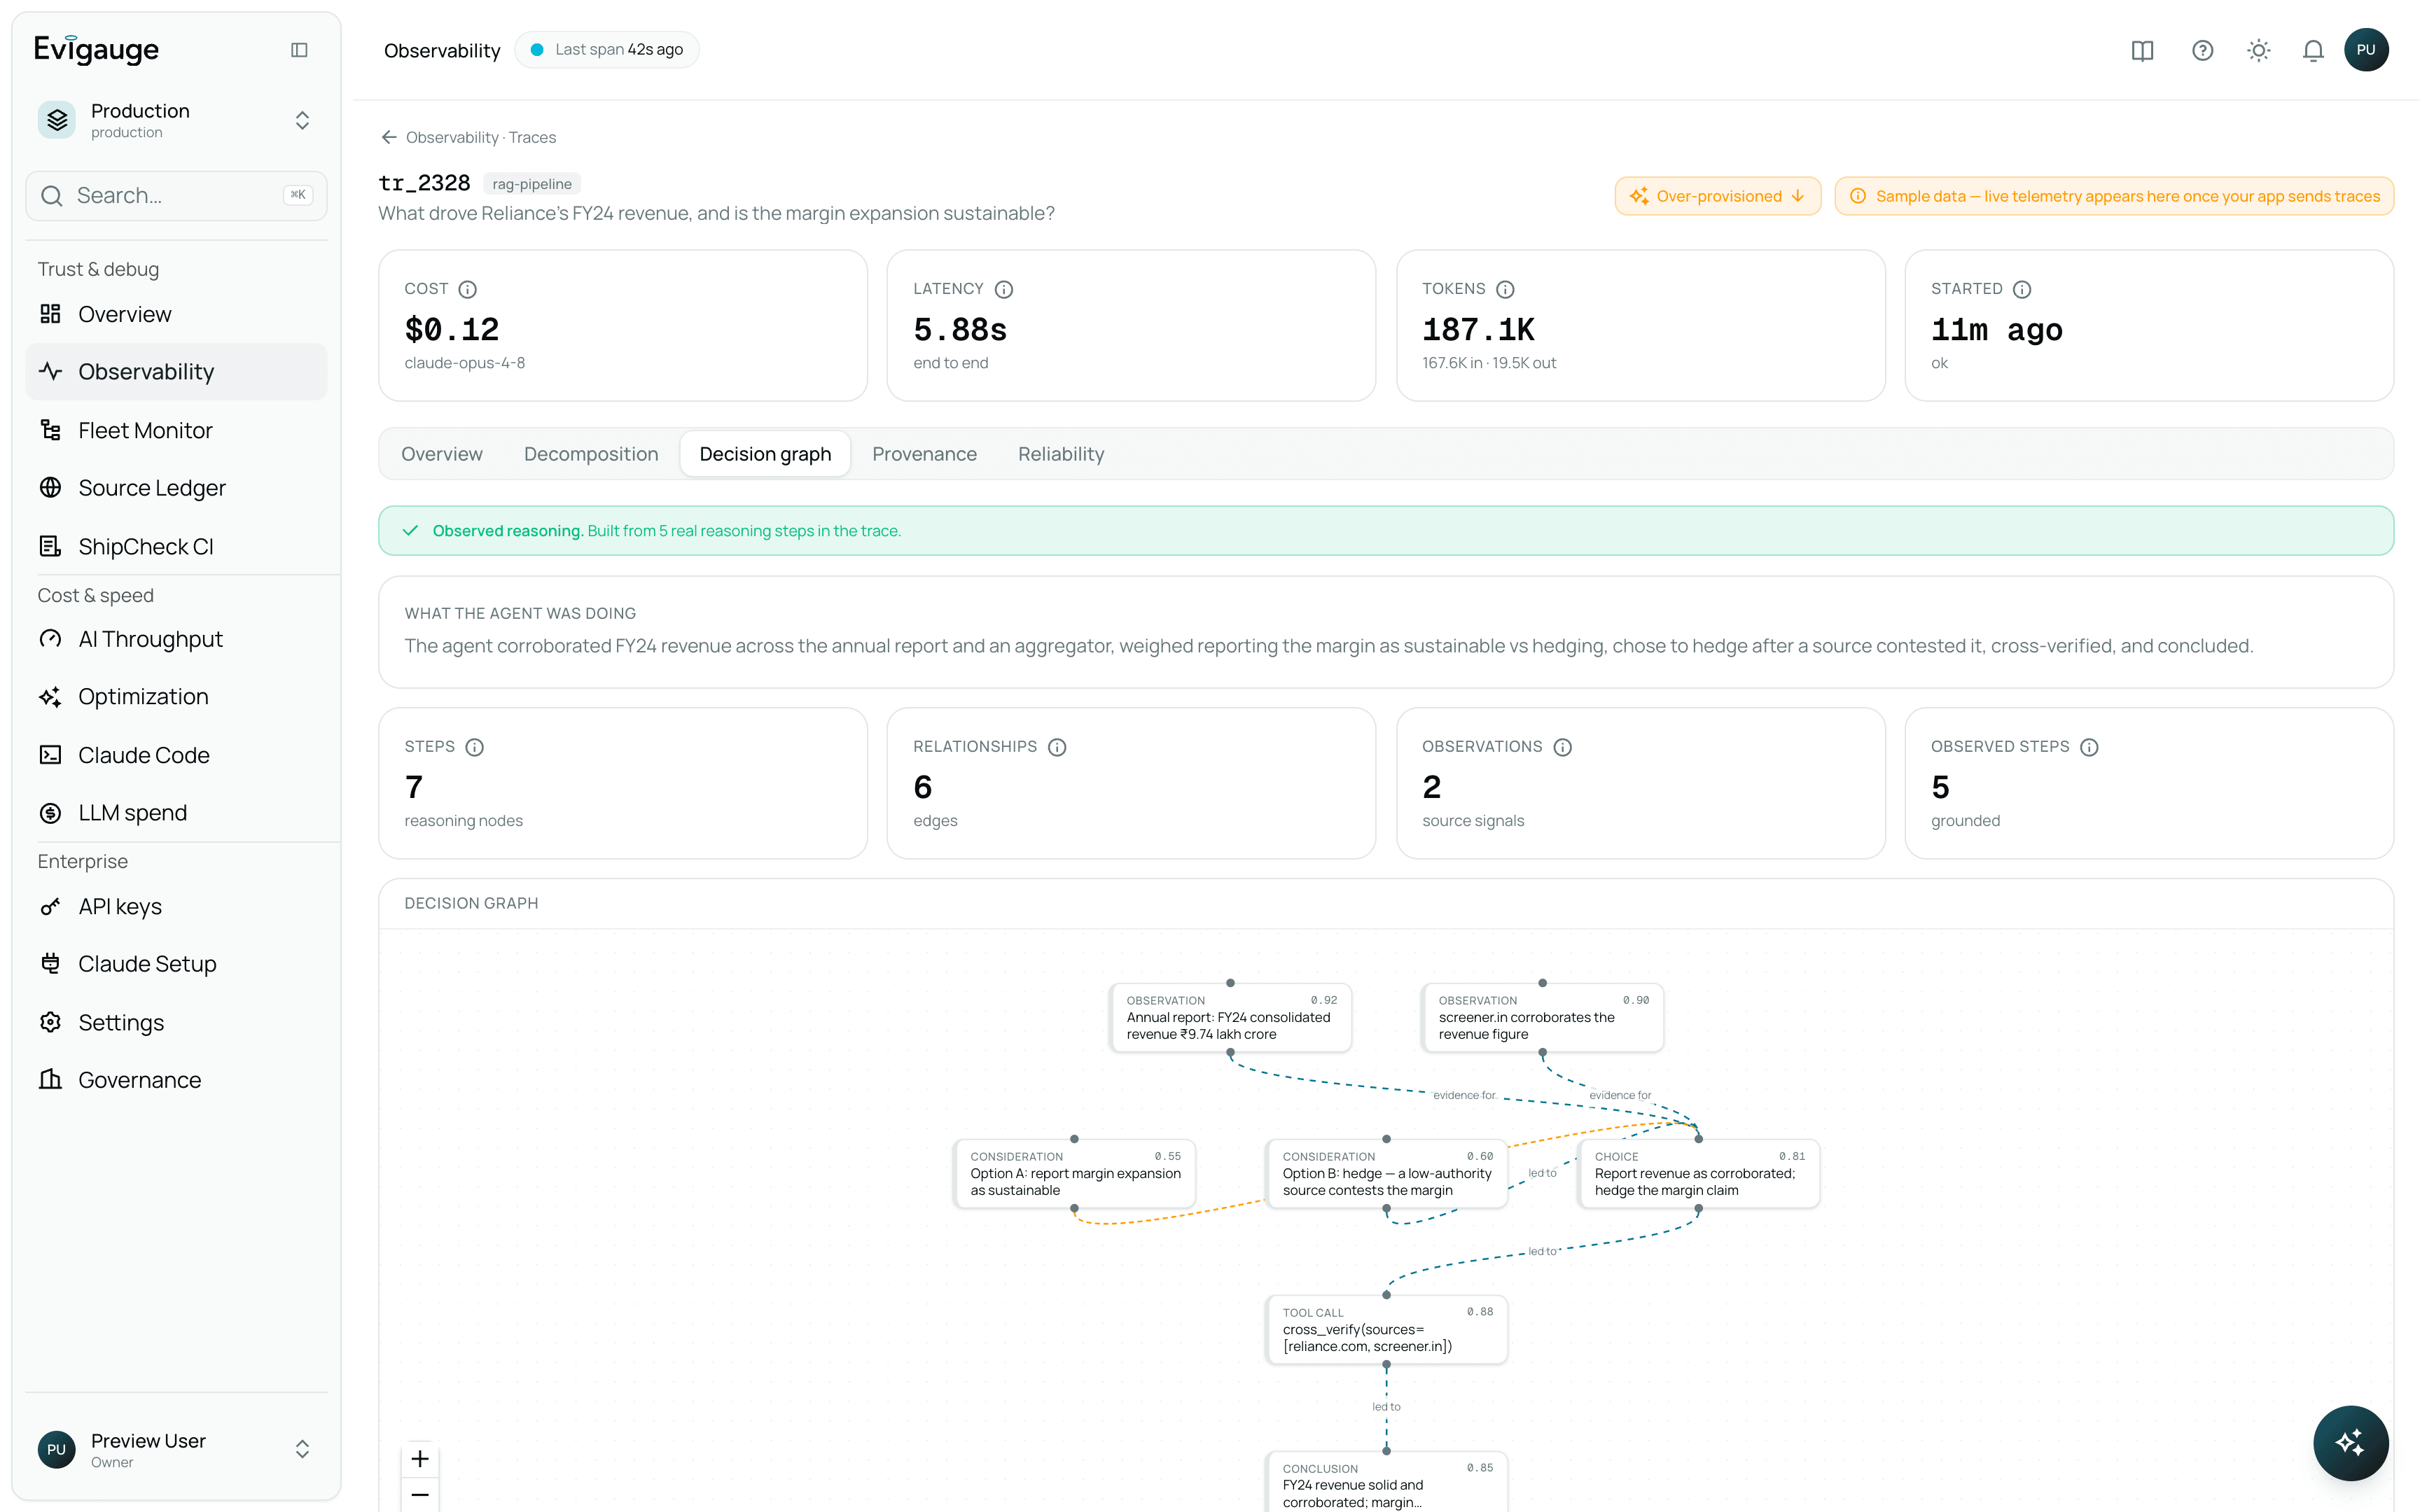
Source matrix
What was cited, what was dropped, and what the model should have seen but never did.
Decision graph
The reasoning map — branch points, tool-call decisions, and what each step depended on.
Reliability grade
Per-claim grounding: did the source actually support the sentence, or did the model just say it?
Real-link verification
A cited URL that doesn't exist, or doesn't back the claim, gets flagged. Defeats hallucinated citations.
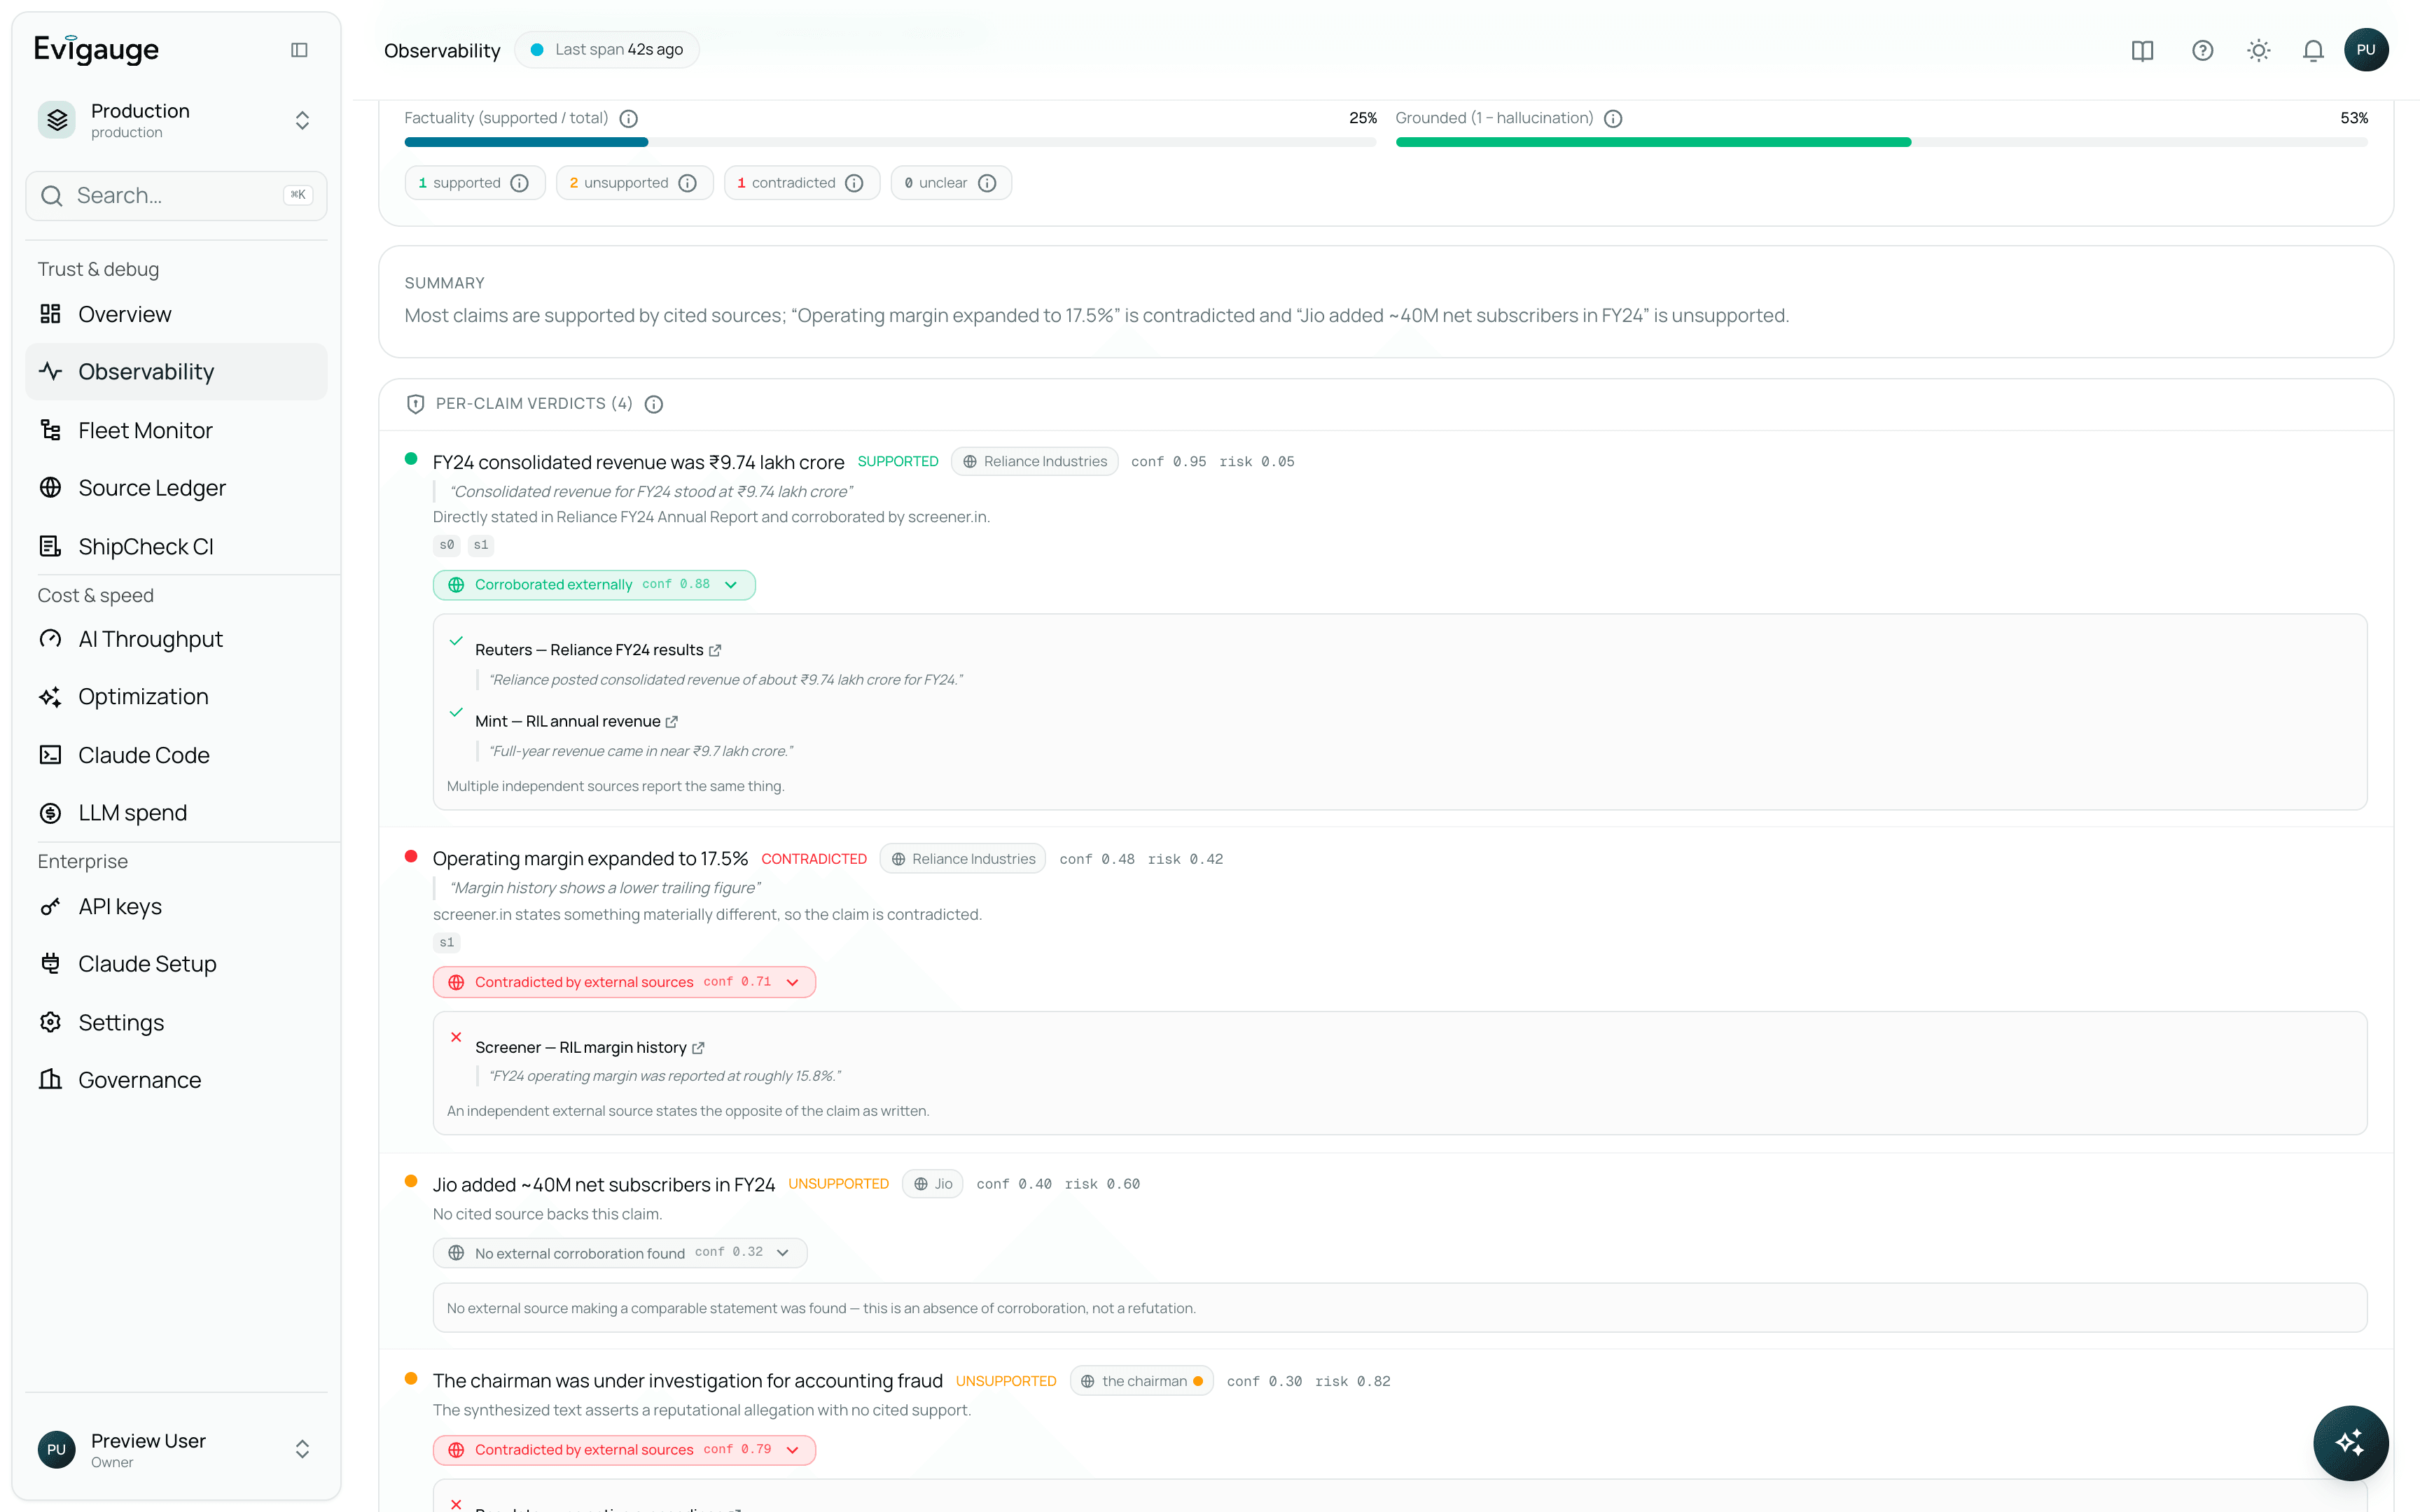
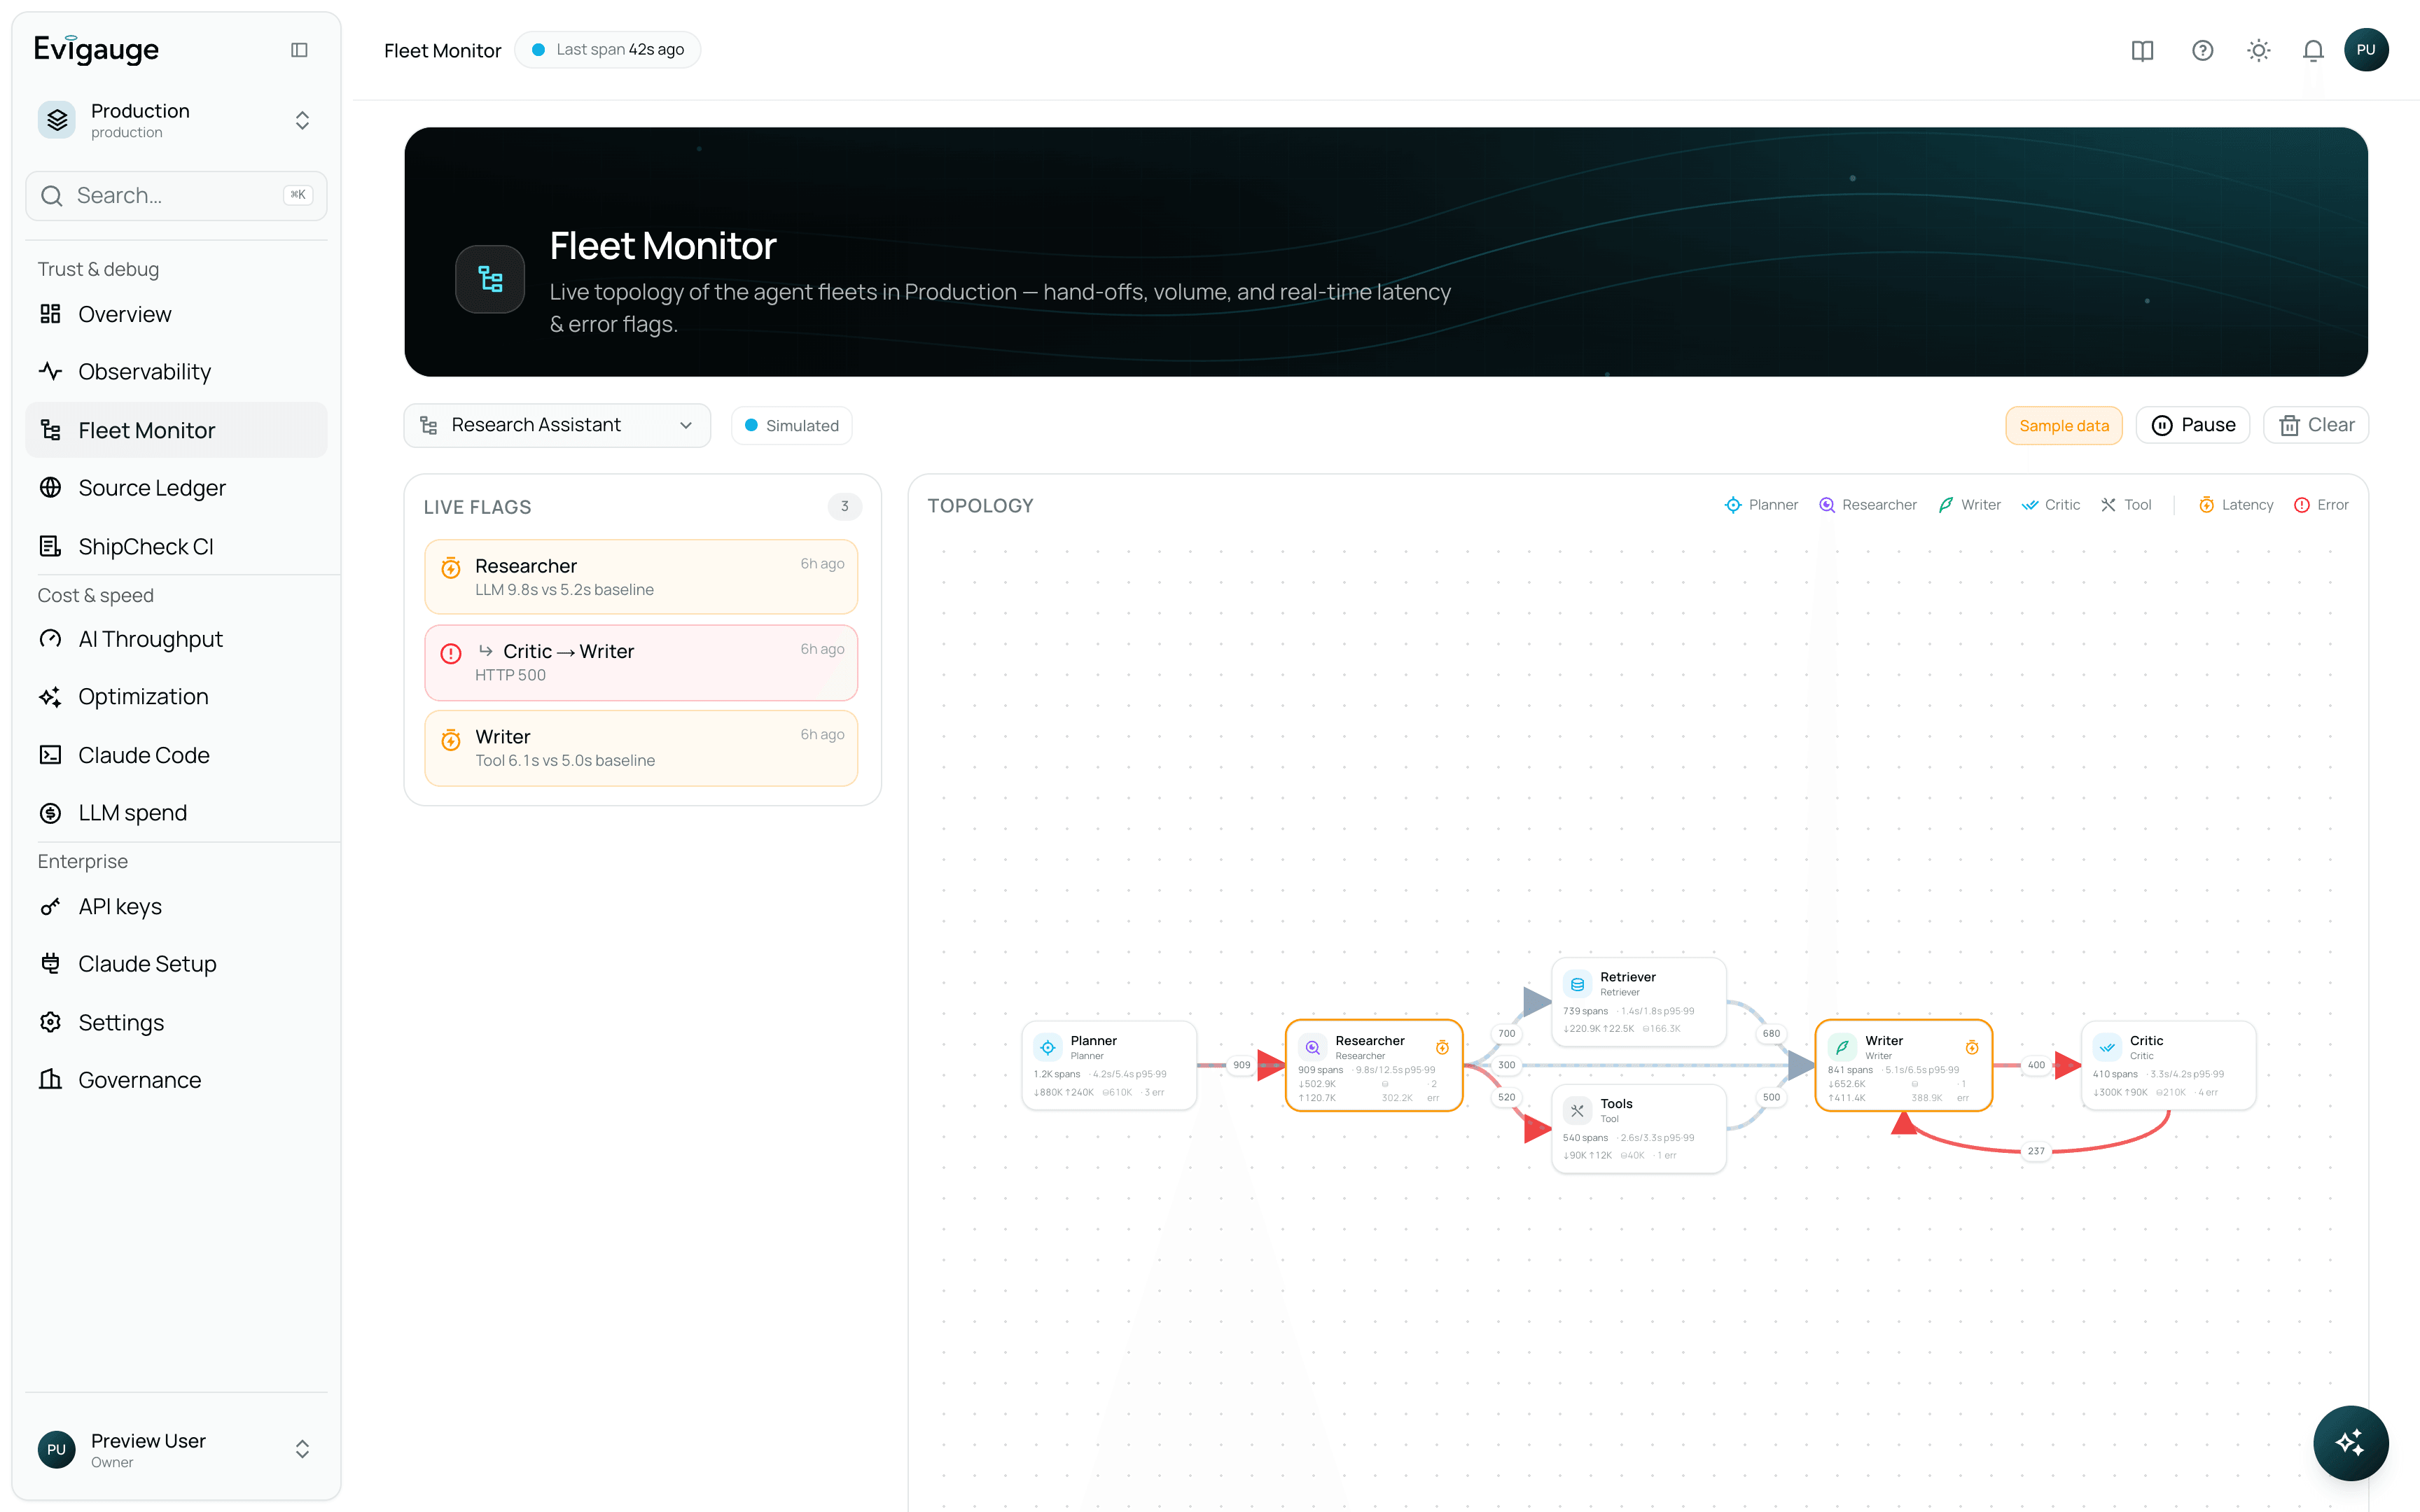
Govern what ships
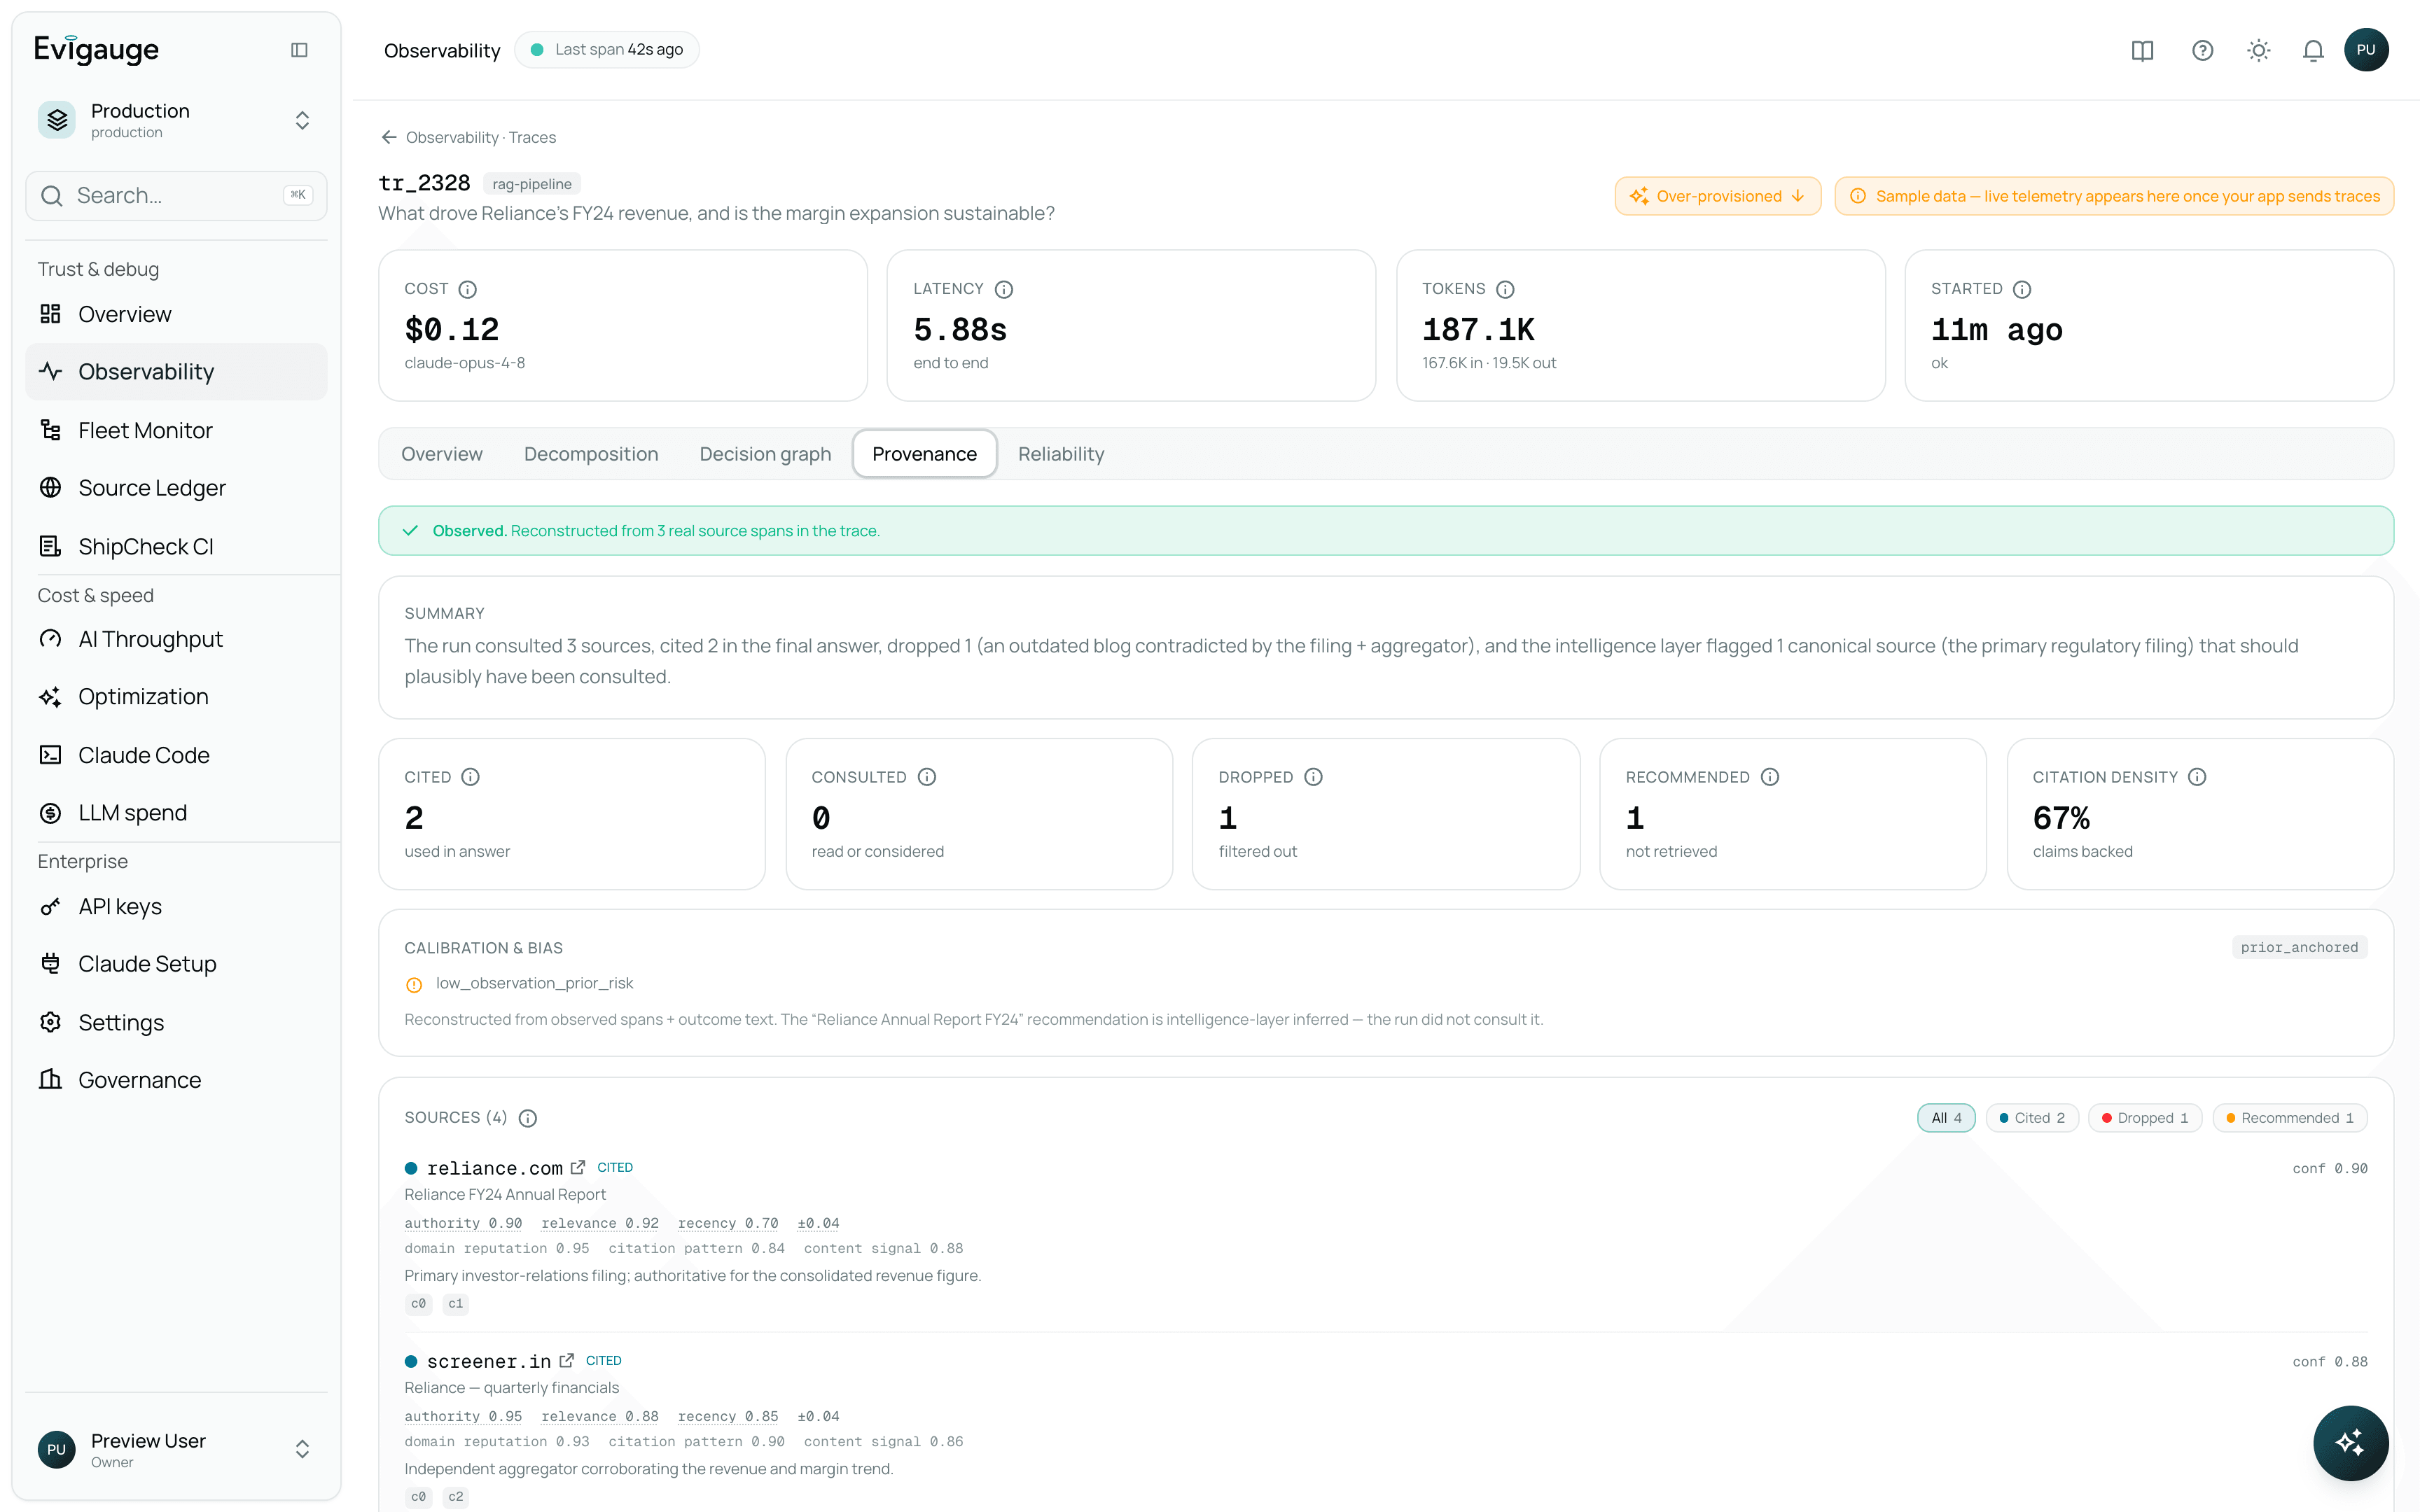
Set a trust boundary per workspace and keep the work that can't touch the open web inside a closed knowledge base. Every crossing is logged, every agent supervised, and every prompt change gated before it reaches production.
- Per-workspace trust boundary with an open-web toggle.
- An access audit trail over the tool itself — who saw what, and when.
Fleet monitor
Live multi-agent topology, per-agent tokens, and latency baselines learned per operation.
Ship Check
A PR-time gate for prompts. Flags a broken cache, a bloated prompt, or rising failures — and can fail the build.
Optimize cost and speed
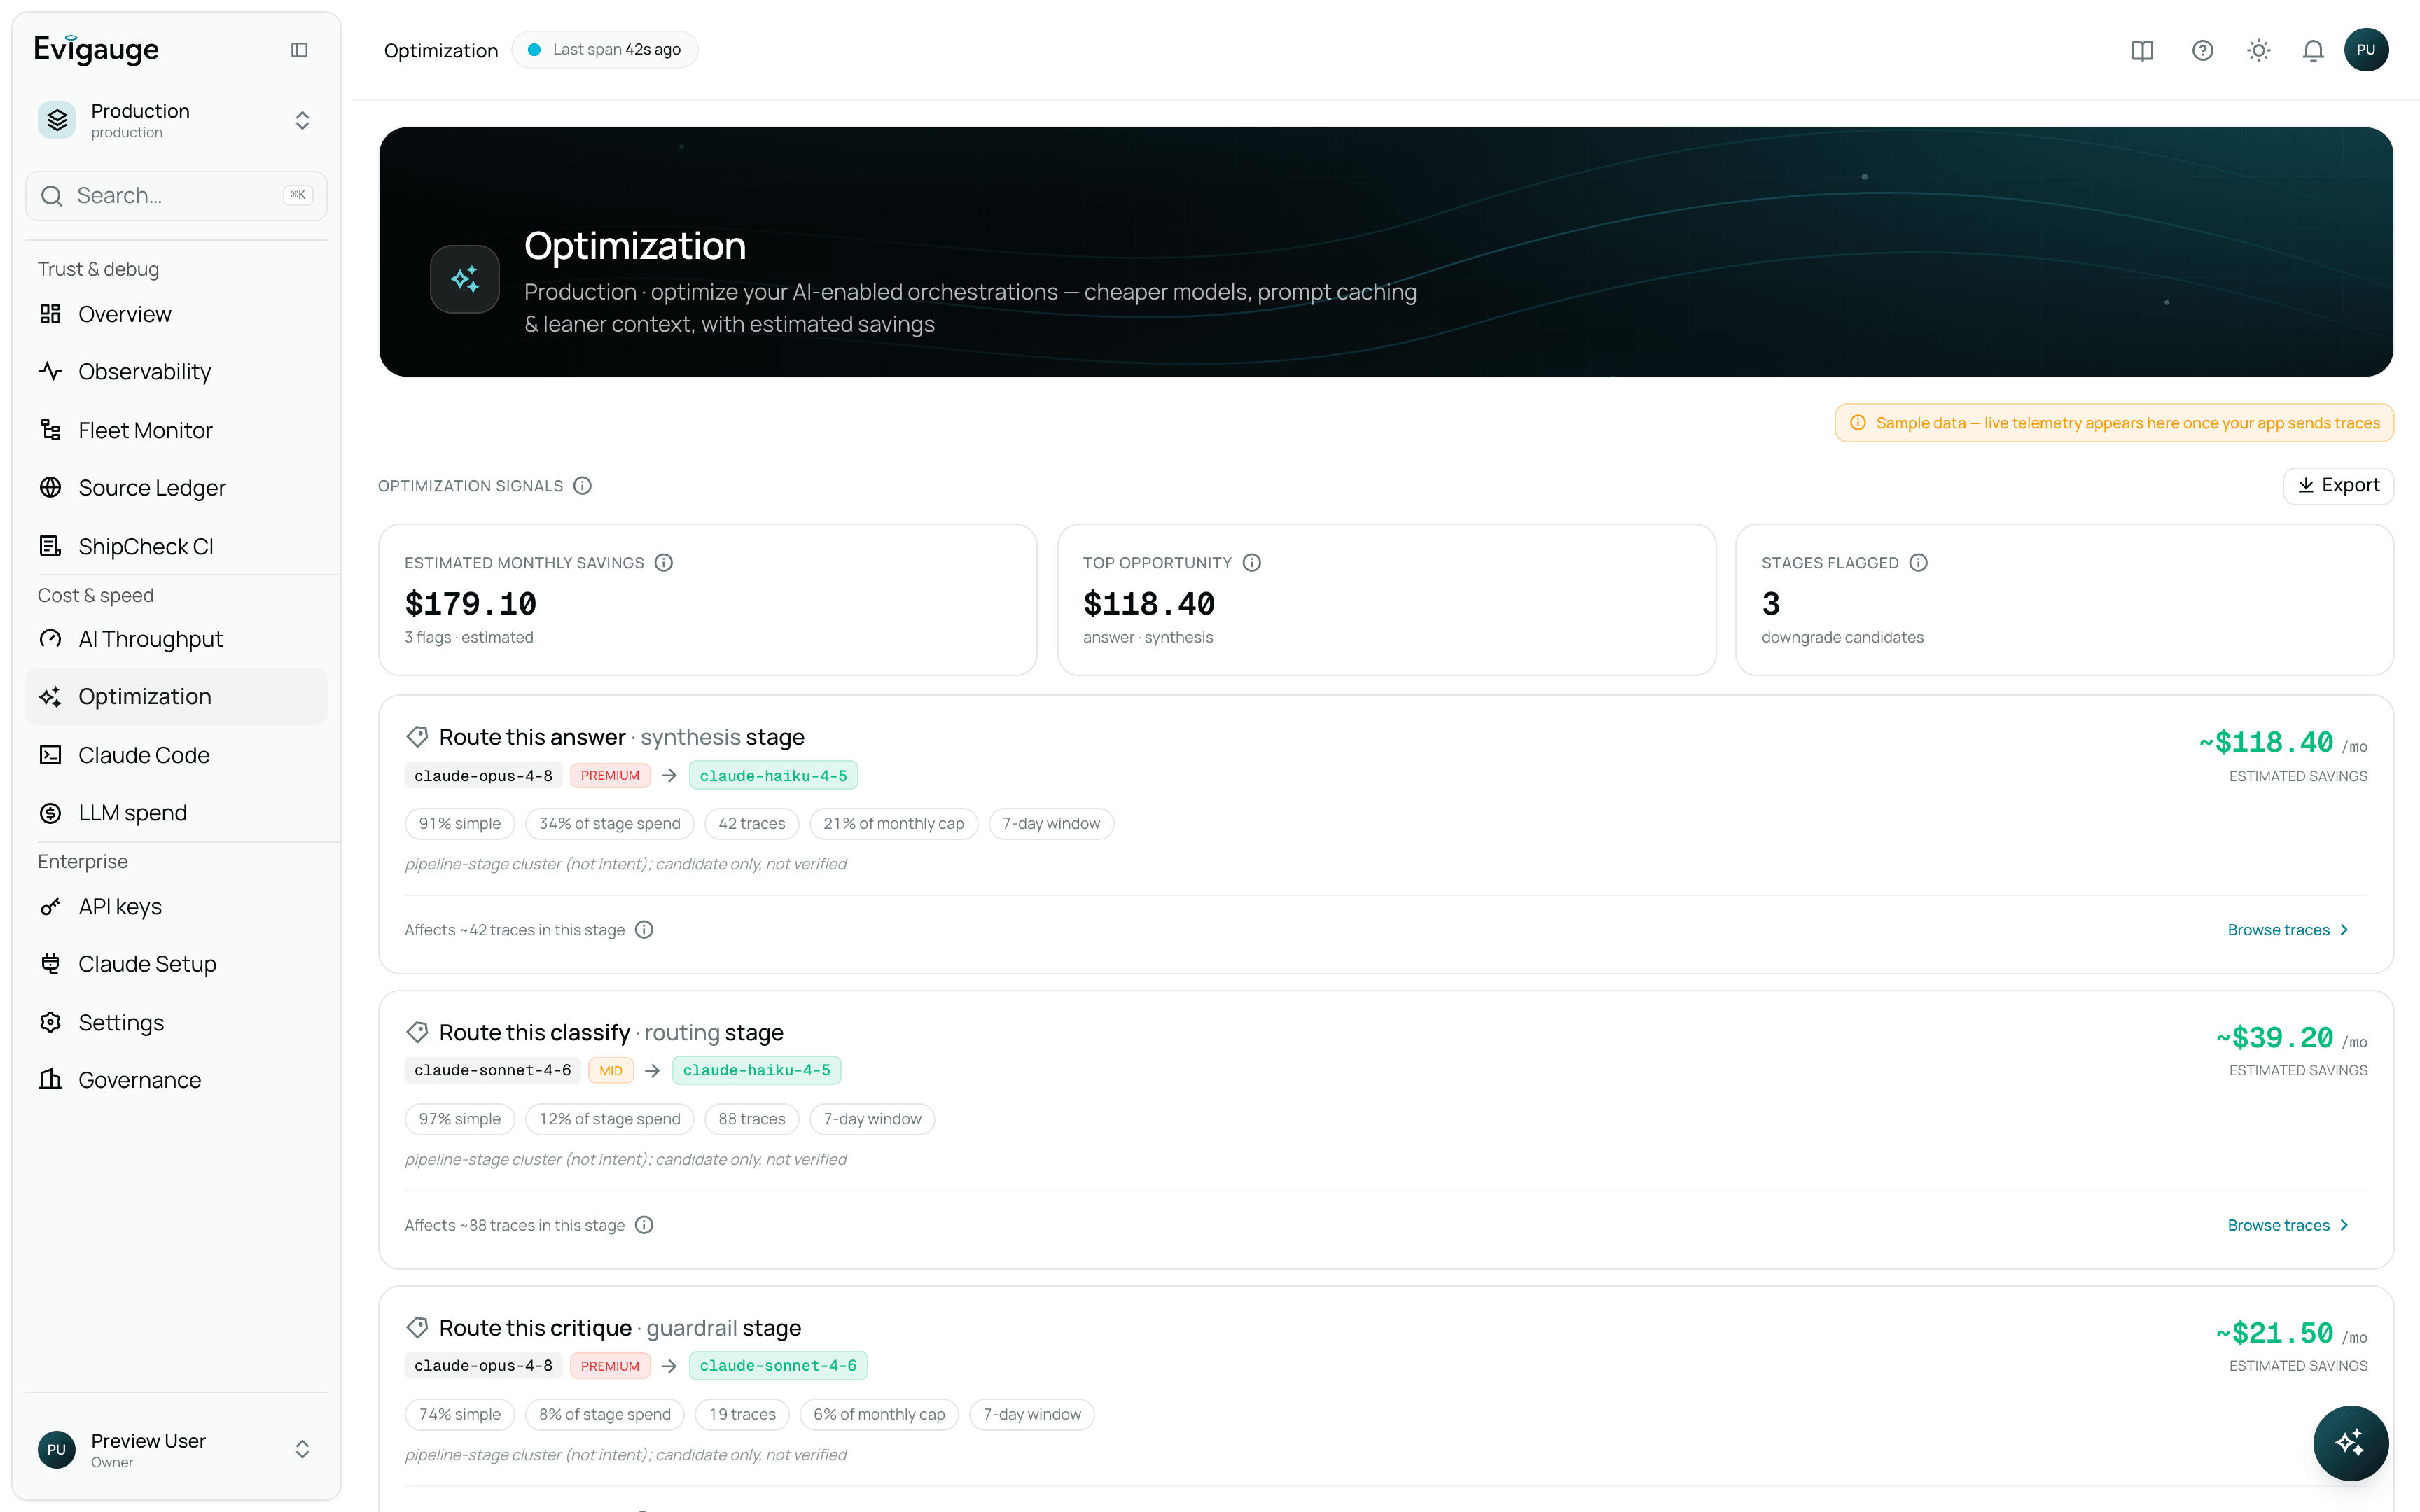
Same models, same quality, lower cost. The correlation engine names the trace where a premium model did simple work, the cheaper model that fits, and the exact dollars — with the offending span attached.
Savings advisor
The cheaper model and the exact dollars, with the span to change — not a number to stare at.
Audit logging
An append-only record of every run, review, and access event — exportable, and sealed so it cannot be edited after the fact.
Prompt optimization
The prompts carrying dead context or a broken cache prefix, with the token saving each rewrite is worth.
Phase-sliced latency
p50 / p95 / p99 by retrieval, tool call, generation, and guardrail — then drill to the offending span.
See it on your own traffic.
45 minutes, your real traces — provenance, reasoning, and cost, reconstructed.
The screens on this page are captures of the live product, shown on sample data. The line diagrams are illustrations rather than captures.